Fig. 5
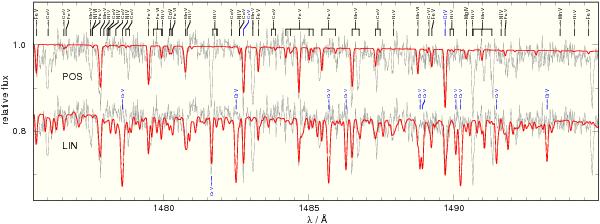
Section of the STIS spectrum (black line) compared with our TMAP model. The SED in the upper panel was calculated using Kurucz’s POS data (the strongest lines are identified at top), the SED in the lower panel using LIN data. This section contains mainly Fe v–vi and Mn v–vi lines. The strongest Cr V LIN lines are identified at the bottom.
Current usage metrics show cumulative count of Article Views (full-text article views including HTML views, PDF and ePub downloads, according to the available data) and Abstracts Views on Vision4Press platform.
Data correspond to usage on the plateform after 2015. The current usage metrics is available 48-96 hours after online publication and is updated daily on week days.
Initial download of the metrics may take a while.