Fig. 16
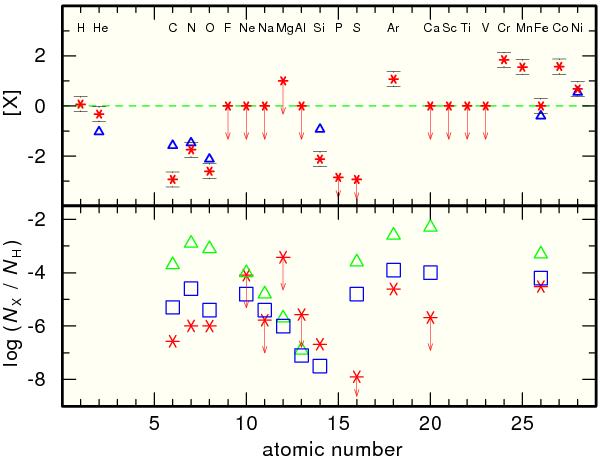
Top: photospheric abundances of BD−22°3467 compared with solar values (Asplund et al. 2009), and mean values from three objects of Good et al. (2005, blue triangles) that are located within the error ellipse (cf. Fig. 15, green squares there). Arrows indicate upper limits. Bottom: comparison of number ratios compared with predictions of diffusion calculations for hydrogen-rich (DA-, blue squares) and helium-rich (DO-type, green triangles) WDs (Chayer et al. 1995a,b) with Teff = 80 kK and log g = 7.2.
Current usage metrics show cumulative count of Article Views (full-text article views including HTML views, PDF and ePub downloads, according to the available data) and Abstracts Views on Vision4Press platform.
Data correspond to usage on the plateform after 2015. The current usage metrics is available 48-96 hours after online publication and is updated daily on week days.
Initial download of the metrics may take a while.