Fig. 6
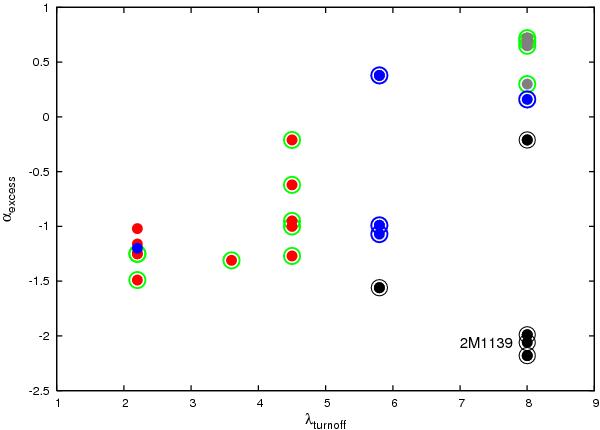
A αexcess vs. λturnoff diagram showing 2M1139 and the transition disk samples in Ophuichus and Taurus. Transition disks with inner holes due to grain growth/dust settling are indicated by red symbols, those due to photoevaporation by blue, and those due to giant planet formation by grey. Debris disks are indicated by black filled symbols. Open green circles indicate objects with accretion rates of 1E-11 to 1E-9 M⊙ yr-1 and values of LD/L∗ between 1E-3 to 1E-2. Blue open circles indicate non-accretors (<1E-11 M⊙ yr-1) with LD/L∗ between 1E-3 and 1E-2. Black open circles indicate non-accretors (<1E-11 M⊙ yr-1) with weak disks (LD/L∗ < 1E-3).
Current usage metrics show cumulative count of Article Views (full-text article views including HTML views, PDF and ePub downloads, according to the available data) and Abstracts Views on Vision4Press platform.
Data correspond to usage on the plateform after 2015. The current usage metrics is available 48-96 hours after online publication and is updated daily on week days.
Initial download of the metrics may take a while.