Fig. 5
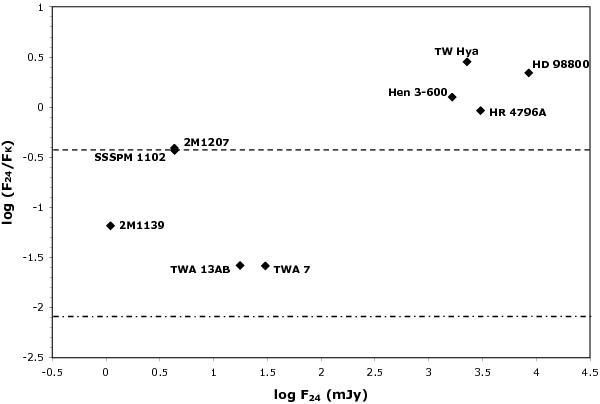
The extent of excess emission at 24 μm for the TWA stars and brown dwarfs. The dot-dashed line represents the limit of F24/FK under the assumption that both bands lie on the Rayleigh-Jeans tail of the stellar spectrum. The dashed line represents a geometrically thin, optically thick flat disk with a spectral slope λFλ ∝ λ−4/3.
Current usage metrics show cumulative count of Article Views (full-text article views including HTML views, PDF and ePub downloads, according to the available data) and Abstracts Views on Vision4Press platform.
Data correspond to usage on the plateform after 2015. The current usage metrics is available 48-96 hours after online publication and is updated daily on week days.
Initial download of the metrics may take a while.