Fig. 2
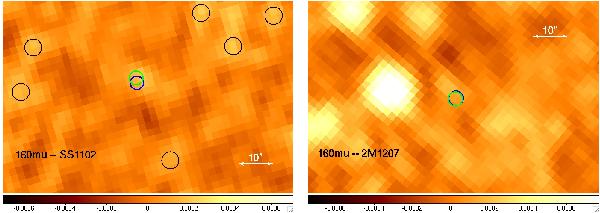
The PACS 160 μm images for SS1102 (top) and 2M1207 (bottom). A blue circle marks the actual target position, and a green circle marks the nominal position. For the SS1102 image, black circles indicate some of the confusion noise dominated regions with similar flux levels as observed at the nominal target position. The image scale for 10″ is shown in the top right. North is up, east is to the left.
Current usage metrics show cumulative count of Article Views (full-text article views including HTML views, PDF and ePub downloads, according to the available data) and Abstracts Views on Vision4Press platform.
Data correspond to usage on the plateform after 2015. The current usage metrics is available 48-96 hours after online publication and is updated daily on week days.
Initial download of the metrics may take a while.