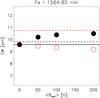
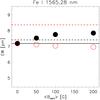
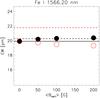
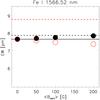
Fig. 6
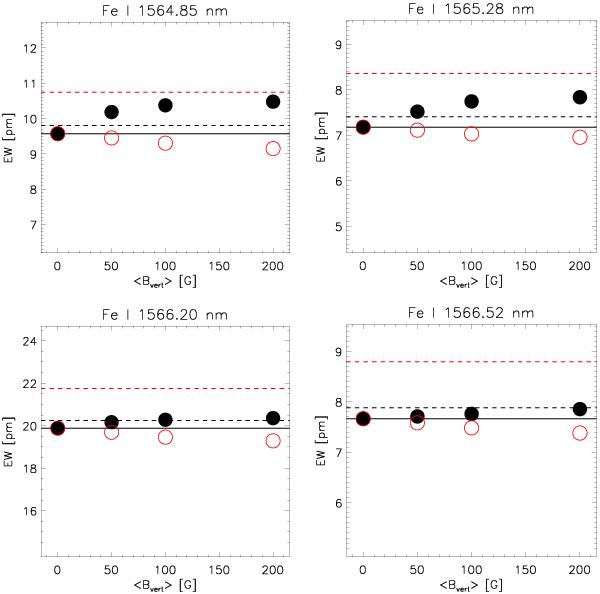
Equivalent width results for the IR spectral lines included in our sample. The symbols are the same as in Fig. 3, except that now, the dashed horizontal lines indicate the equivalent width value predicted when increasing the iron abundance in the HD model by 0.02 and 0.10 dex. This translates to negative abundance corrections of the same magnitude applicable to the abundance predicted using the HD model (see discussion in text).
Current usage metrics show cumulative count of Article Views (full-text article views including HTML views, PDF and ePub downloads, according to the available data) and Abstracts Views on Vision4Press platform.
Data correspond to usage on the plateform after 2015. The current usage metrics is available 48-96 hours after online publication and is updated daily on week days.
Initial download of the metrics may take a while.