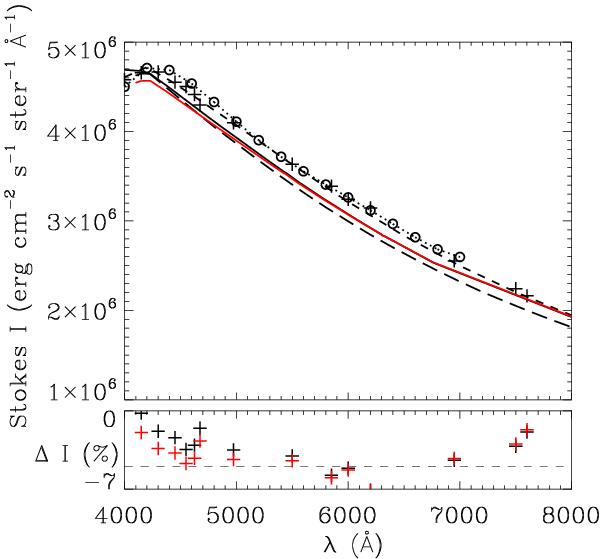
Fig. 2
Top panel: comparison of our computed solar disc centre continuum intensity in the non-magnetic and 200 G case (solid black and red curves, respectively) to data from the literature. The long-dashed curve is based on the results obtained by Trujillo Bueno & Shchukina (2009) using a single 3D HD snapshot by Asplund et al. (2000a); the dotted curve with circles is based on Ayres et al. (2006); the short-dashed curve refers to the semi-empirical 1D MACKKL model of the “quiet” Sun atmosphere (see Table II of Maltby et al. 1986); finally, black crosses indicate the observational data from Neckel & Labs (1984, Table VII). Bottom panel: intensity difference (in percentage) between our results and the observational data (black crosses = HD-obs; red crosses = 200 G-obs; dashed horizontal line = –5% level).
Current usage metrics show cumulative count of Article Views (full-text article views including HTML views, PDF and ePub downloads, according to the available data) and Abstracts Views on Vision4Press platform.
Data correspond to usage on the plateform after 2015. The current usage metrics is available 48-96 hours after online publication and is updated daily on week days.
Initial download of the metrics may take a while.