Fig. 1
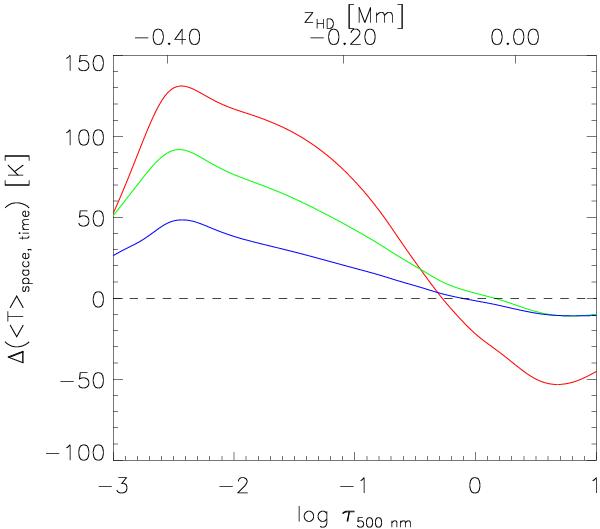
MHD-HD difference of the temperature stratification obtained for layers close to photospheric line-forming regions after averaging horizontally on surfaces of equal optical depth and temporally over the (63 × 63 column) input snapshots used in the spectral synthesis. Blue, green and red lines represent the difference in temperature with respect to the HD case, against log 10τ(500 nm) (bottom horizontal axis), for the 50 G, 100 G and 200 G cases, respectively. The top horizontal axis shows the corresponding physical depth in Mm in the HD case.
Current usage metrics show cumulative count of Article Views (full-text article views including HTML views, PDF and ePub downloads, according to the available data) and Abstracts Views on Vision4Press platform.
Data correspond to usage on the plateform after 2015. The current usage metrics is available 48-96 hours after online publication and is updated daily on week days.
Initial download of the metrics may take a while.