| Issue |
A&A
Volume 548, December 2012
|
|
|---|---|---|
| Article Number | A93 | |
| Number of page(s) | 5 | |
| Section | Extragalactic astronomy | |
| DOI | https://doi.org/10.1051/0004-6361/201219179 | |
| Published online | 29 November 2012 | |
Research Note
A relation between circumnuclear H I, dust, and optical cores in low-power radio galaxies
1
Netherlands Institute for Radio Astronomy (ASTRON),
PO Box 2
7990 AA
Dwingeloo,
The Netherlands
e-mail: This email address is being protected from spambots. You need JavaScript enabled to view it.
2
Kapteyn Astronomical Institute, PO Box 800, 9700 AV
Groningen, The
Netherlands
3
National Radio Astronomy Observatory (NRAO),
PO Box O,
Socorro, NM
87801-0387,
USA
Received: 7 March 2012
Accepted: 29 October 2012
Abstract
From new observations and literature data we investigate the presence of H I, dust, and optical cores in the central kiloparsec of low-power radio galaxies. The goal of this pilot study is to identify physical relations between these components, which can help us to study kinematics and feeding mechanisms in future samples of active galaxies. Our results are consistent with neutral gas being associated with dust on sub-kiloparsec scales. Objects that have H I absorption always have significant amounts of dust in their host galaxy. If there is no visible dust in the host galaxy, there is also no H I absorption. The presence of an unresolved optical core correlates with the H I column density, with the core being absent in high-column density sources. This work opens a path for studying the kinematics of cold material in the central regions of active galaxies by combining information of H I absorption and molecular lines. Consistent with previous work, we find no evidence for a compact, parsec-scale obscuring torus in low-power radio galaxies.
Key words: galaxies: active / radio lines: galaxies / radio lines: ISM / radio continuum: galaxies / galaxies: ISM / galaxies: evolution
© ESO, 2012
1. Introduction
The central regions of active galaxy nuclei (AGN) harbour essential clues to how these amazing objects work. Differences on small scales lead to enormous variety of observed characteristics on large scales. For radio-loud AGN, a distinction is made between high- and low-power radio galaxies, referred to as FR II and FR I, respectively (Fanaroff & Riley 1974). Differences between these sources occur in radio morphology, optical, and X-ray properties. They are attributed to different accretion rates or accretion modes (see e.g. Buttiglione et al. 2010). This implies differences in kinematics and morphology of gas and dust in the central regions.
One difference between high- and low-power radio galaxies is well established. Unified schemes postulate a parsec-scale, thick dust torus to explain the bimodality in optical spectra of high-power FR II radio galaxies (e.g. Barthel 1989; Antonucci 1993). In contrast, the optical nuclei of FR I radio galaxies appear unobscured (e.g. de Koff et al. 1996; Chiaberge et al. 1999; Capetti et al. 2002), though the host galaxies often have kiloparsec-scale dust rings and lanes (de Koff et al. 2000; Verdoes-Kleijn et al. 2002; de Ruiter et al. 2002). Chiaberge et al. (1999) found that the brightness of the optical core correlates with the brightness of the radio core. Therefore, they concluded that the optical core emission is non-thermal, coming from the active nucleus. This is only possible if a parsec-scale torus is absent. X-ray observations confirm this absence and find evidence for a different accretion mode in FR I radio galaxies (Balmaverde et al. 2006; Hardcastle et al. 2009).
A major question in AGN research is how the material is transported from kiloparsec scales to the sub-parsec scale. This requires kinematical studies at high spatial and velocity resolution. Due to their proximity, FR I radio galaxies are best suited for this purpose. H I absorption observations are a powerful tool for studying kinematics on small scales (e.g. van Gorkom et al. 1989; Morganti et al. 2001, 2003; Vermeulen et al. 2003; Gupta et al. 2006). Molecular lines can provide essential additional information, as they also trace the cool interstellar medium. In this paper we present a pilot study to explore the relation between dust (associated with the molecular lines) and neutral gas (associated with the H I) on kiloparsec scales or smaller. If we can relate the gas and dust on sub-kiloparsec scales, future studies can combine information from these sources to generate a complete kinematical picture.
VLA sample description (Cols. 1 through 6) and observational results (Cols. 7 through 10).
We expand upon earlier studies by combining H I information with Hubble Space Telescope (HST) imaging. Our primary goal is to determine if the presence of an optical core is associated with the absence of H I absorption. Next, we search for a relation between the dust and H I, where we expect to see absorption if dust lies in the line-of-sight to the radio source. If H I is indeed associated with the dust, deeper H I observations can be combined with molecular line data to study the kinematics of the central regions in a complete sample. This work is essential to provide new insight into AGN fueling and feedback.
2. The sample
Our sample consists of low-power radio galaxies1: log P1.4 GHz < 25.5 W Hz-1. They all have typical FR I (core-dominated) radio morphologies. The host galaxies are early-type galaxies, with a range of ellipticities and environments. For our new VLA observations we selected a representative sample of eight FR I radio galaxies (see Table 1) from the HST snapshot survey of the B2 catalogue (Capetti et al. 2002). The HST snapshot images trace dust down to scales of ~100 pc and are used to identify the presence of an optical unresolved core.
To increase the sample size, we have added 14 FR I radio galaxies from literature. They were selected to match our criterion for radio power, and to have H I data and optical HST images available. This literature sample consists of results obtained by van Gorkom et al. (1989, hereafter JvG89), and four additional sources from van Gorkom et al. (1986), De Young et al. (1973), Jaffe & McNamara (1994), and van der Hulst et al. (1983).
H I and optical properties of the sample, split in H I detections and non-detections.
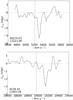 |
Fig. 1 Plot of the continuum subtracted spectra for two of the detected sources from the VLA sample. The dashed vertical line indicates the systemic velocity. The x-axis is in optical barycentric velocity. The spectra are obtained against the brightest part of the radio source, which in both of these cases corresponds to the core. |
The total sample has 22 objects and is not meant to be complete, but representative of this type of radio sources. The full sample is listed in Table 2.
3. Observations and H I results
3.1. VLA observations
We observed eight sources with the VLA in A-configuration during December 2000 and January 2001. Observations were made with 6.25 MHz bandwidth and 64 channels. The data were reduced with CASA2. We performed the default steps for H I absorption line data reduction, which are described in the online manual for H I absorption reduction in CASA3. Hanning smoothing was applied after the calibration steps. Observational parameters for each source are listed in Table 1.
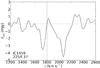 |
Fig. 2 Plot of the H I absorption detected in IC 1459 with the ATCA telescope. For comparison with the VLA spectra, the plot has been smoothed to a velocity resolution of 40 km s-1. |
H I absorption is detected in four out of eight sources (see Table 1). The peak-absorbed flux exceeds 5σ, with σ being the rms noise per channel. The source 4C 26.42 is a new detection. The 3σ absorption peak in NGC 7052 is considered a non-detection, though it shows a hint of a resolved line. Since our observations, four sources have been studied with other telescopes. NGC 315 is presented in Morganti et al. (2009); 3C 293 was observed at high resolution by Beswick et al. (2002); and NGC 5141 and NGC 7052 were observed at lower resolution in Emonts et al. (2010). Only NGC 7052 was not detected, and a stringent upper-limit was set. Our column densities and H I profiles are consistent with literature results. With our limited bandwidth and sensitivity we cannot recover the very broad component in 3C 293 (Morganti et al. 2003). Two representative spectra, including 4C 26.42, are shown in Fig. 1.
3.2. Additional data
A detection of H I absorption in IC 1459 has been obtained with the Australia Telescope Compact Array. IC 1459 was observed with 16.0 MHz bandwidth, at a velocity resolution of 13 km s-1 (before Hanning smoothing) and with the 375 m configuration (Oosterloo et al. 1998, see Fig. 2). The rms noise is 1.4 mJy beam-1 after Hanning smoothing. Although the spatial resolution of these observations is very poor, the background source is unresolved on arcsecond scales (Sadler et al. 1989). Therefore, we can assume that the absorption is coming from these small scales.
The giant radio galaxy NGC 6251 is listed as a non-detection by JvG89. However, Evans et al. (2005) reported an unpublished column density of 4.5 × 1020 cm-2. To confirm this, we obtained a 12 hour WSRT service observation, with 1024 channels and a bandwidth of 20 MHz. The observation was processed similar to the VLA observations. We found no detection and set an upper limit of NHI < 0.3 × 1020 cm-2 for this source.
3.3. HI column density
To derive the H I column density in units of cm-2, we used the standard equation  (1)in which TS is the spin temperature and fc the covering fraction, τS is the optical depth summed over the channels where absorption is present, and Δυch is the velocity width of a single channel. The product τS·Δυch is the integrated optical depth, τint. We assumed a spin temperature of 100 K and a covering fraction of 1.
For non-detections we replaced the integral with the outcome for a Gaussian profile  (2)in which τp is the peak optical depth and ΔυFWHM the velocity width of the Gaussian at half maximum. In a non-detection the peak absorption depth is assumed to be less than 3σ, with σ equal to the rms noise per channel. Since τp ≈ Sabs/Sc, we can replace τp by 3σ/Sc, with Sc being the core flux at 1.4 GHz. The resulting upper limit of column density is then
 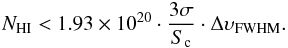 (3)We assumed the average velocity width of the detected sources for the line width ΔυFWHM = 100 km s-1. For a proper comparison, we recalculated the literature upper limits, which use different values.
The H I absorption technique is limited to objects with a bright core. Hence, in sources with a faint core, we may be missing H I if it has a low column density. In our small VLA sample this bias is not obvious. In the source with the weakest core, NGC 5141, H I is detected with an integrated optical depth of 5.5 ± 1.0. The results for all VLA observations are listed in Table 1.
Combining all the results, we have 11 detections and 11 non-detections. Owing to our selection method, these numbers cannot be used to derive detection rates for the population of low-power radio galaxies as a whole.
 |
Fig. 3 Histograms of the distributions of dust (a) and optical cores (b) in the H I detections and non-detections. |
4. Results
The goal of this study is to compare the detection of H I in absorption with the presence of kiloparsec-scale dust and an optical core.
4.1. Relation between neutral gas, dust, and optical core
The trends we find are illustrated in Figs. 3 and 4 and are listed in Table 2. They can be summarized as follows:
-
1.
All H I absorption detectionshave significant amounts of dust in their host galaxies, andsources without visible dust in the host galaxies have noH I absorption(Fig. 3(a)).
-
2.
All sources without H I detection have an optical core (Fig. 3(b)).
-
3.
Sources with NHI > 1021 cm-2 have no optical core (Fig. 4).
We found sources with H I absorption that have an optical core, see Fig. 4. These sources have either extended dust far from the nucleus (see Sect. 4.2), or disks with low inclination, consistent with a line of sight through a less dense medium. If NH > 1021 cm-2, the unresolved optical core is not detected. This column density corresponds to a visible extinction of ~1 mag for Galactic extinction (Predehl & Schmitt 1995). Because we have no handle on the intrinsic brightness of the optical core, future work on a larger, complete sample will have to clarify the scientific merit of our third result.
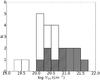 |
Fig. 4 Distribution of H I column density for the sample. The detections are grey, the detections with an optical core are hatched. Within the detections there is a clear trend for the sources without an optical core to have a higher H I column density. This is reflected in the entire sample, taking into account that the non-detections in the white area only have upper limits of H I column density and all have an optical core. |
4.2. Dust morphology
In the optical images we find three distinct morphologies for the dust:
-
Extended: dust extending up to tens of kpc. In many sources thisdust does not show any symmetry with respect to the core of thegalaxy, often it is diffuse and/or filamentary. Some extended duststructures show evidence for smaller scale arms, or have afeather-like appearance. In a few sources it appears as a large dustlane (e.g. Centaurus A).
-
Disks: dust in a well-defined and symmetric distribution. The dust disks are rather compact, having radii of several hundreds of parsec. We find no disks with radii larger than 1 kpc.
-
None: in the HST images there is no visible dust.
Our classification of dust structures is consistent with results from de Ruiter et al. (2002).
The 11 sources with H I absorption all have dust, and are split between extended dust (5) and disks (6). The disks are at high inclinations, with a median value of 73°. Extended dust either covers the optical core, or is located at less than one HST resolution element from the core. The exception is 3C 84, where the dust is more than 1′′ from the optical core. This source is known to have a galaxy in the line of sight. This was first discussed by Minkowski (1957) and later confirmed by Lynds (1970). Two separate H I absorption components are seen. The velocity differences are consistent with a component associated with the foreground galaxy and another with the radio galaxy (De Young et al. 1973; Rubin et al. 1977). It is not clear where the dust is located. VLBI observations are ongoing to spatially resolve the H I absorption components in this complex source.
Among the 11 H I non-detections, 6 sources have dust. In four cases the dust is either in a face-on disk (e.g. 3C 31) or at large projected distance from the core. The remaining two, NGC 6251 and NGC 7052, have an edge-on dust disk. The non-detection of NGC 6251 can be explained by the existence of a strong warp in the inner regions. While the outer parts of the disk are nearly edge-on at 76° inclination, the inner regions are at 35° inclination (Ferrarese & Ford 1999). If neutral gas is present in the dust disk, this would significantly suppress the column density of H I in the center. NGC 7052 has the weakest radio core in our sample, which makes it the most difficult source to detect. Nevertheless, Emonts et al. (2010) set a stringent upper limit. Higher resolution observations of this source may provide insight into the structure of the disk.
In sources without dust there is no detection of H I, and they have an unresolved optical core. Though this is consistent with the absence of obscuration on all scales, for these five sources alone we cannot fully exclude orientation effects. Considering the sample as a whole, we would expect a tighter relation between the absence of an optical core and the presence of H I absorption if a small-scale torus were present. This is not reflected in our results.
5. Conclusions
We have studied the presence of H I, dust, and optical cores in the central kiloparsec of low-power radio galaxies. We find that the presence of H I absorption is linked to the presence of dust. Furthermore, the absence of H I absorption is linked to the presence of an optical core. The optical core is not detected if NHI > 1021 cm-2. Our results are consistent with neutral gas being associated with extended dust and dust in the kiloparsec-scale disks. We require no parsec-scale dust torus.
The distribution of H I may be more complicated than a regular rotating central disk. This is evident from structure in the absorption profile, and is demonstrated by several higher resolution studies. H I distributed in clouds with a filling factor much lower than unity, and H I in infalling and outflowing structures are seen (see the case of NGC 315, Morganti et al. 2009). Only VLBI observations will allow one to distinguish these effects. For sources with H I absorption, the line kinematics is an essential component for understanding the feeding mechanism of active galaxies. Further insight into the physics of kiloparsec-scale disks will require deep observations of a complete sample. These are currently ongoing. More work will be done by the large surveys planned with the SKA pathfinders.
Finally, molecular line transitions can provide crucial complementary information on the kinematics of the disks. This is especially important for sources that do not have a bright, unresolved radio core. This work opens a potential path for
combining molecular lines with H I absorption to study kinematics on sub-kiloparsec scales. Systematic studies of the cold, molecular gas component are now starting. However, Flaquer et al. (2010) found that radio galaxies tend to have relatively low molecular gas masses. Given the limited sensitivity of current instruments, ALMA will make a major leap in this field.
Throughout this paper we use H0 = 70 km s-1 Mpc-1.
Acknowledgments
We gratefully acknowledge discussions with Neeraj Gupta, Raymond Oonk, Preeti Kharb and Gijs Verdoes Kleijn. We thank Jacqueline van Gorkom for pointing us to relevant information on ISM physics. The VLA is operated by the National Radio Astronomy Observatory, a facility of the National Science Foundation operated under cooperative agreement by Associated Universities, Inc. This research has made use of the NASA/IPAC Extragalactic Database (NED) which is operated by the Jet Propulsion Laboratory, California Institute of Technology, under contract with the National Aeronautics and Space Administration. Based on observations made with the NASA/ESA Hubble Space Telescope, and obtained from the Hubble Legacy Archive, which is a collaboration between the Space Telescope Science Institute (STScI/NASA), the Space Telescope European Coordinating Facility (ST-ECF/ESA) and the Canadian Astronomy Data Centre (CADC/NRC/CSA). This research has made use of Aladin.
References
- Antonucci, R. 1993, ARA&A, 31, 473 [Google Scholar]
- Balmaverde, B., Capetti, A., & Grandi, P. 2006, A&A, 451, 35 [NASA ADS] [CrossRef] [EDP Sciences] [Google Scholar]
- Barthel, P. D. 1989, ApJ, 336, 606 [Google Scholar]
- Beswick, R. J., Pedlar, A., & Holloway, A. J. 2002, MNRAS, 329, 620 [NASA ADS] [CrossRef] [Google Scholar]
- Buttiglione, S., Capetti, A., Celotti, A., et al. 2010, A&A, 509, A6 [NASA ADS] [CrossRef] [EDP Sciences] [Google Scholar]
- Capetti, A., Celotti, A., Chiaberge, M., et al. 2002, A&A, 383, 104 [NASA ADS] [CrossRef] [EDP Sciences] [Google Scholar]
- Chiaberge, M., Capetti, A., & Celotti, A. 1999, A&A, 349, 77 [NASA ADS] [Google Scholar]
- de Koff, S., Baum, S. A., Sparks, W. B., et al. 1996, ApJS, 107, 621 [NASA ADS] [CrossRef] [Google Scholar]
- de Koff, S., Best, P., Baum, S. A., et al. 2000, ApJS, 129, 33 [NASA ADS] [CrossRef] [Google Scholar]
- de Ruiter, H. R., Parma, P., Capetti, A., Fanti, R., & Morganti, R. 2002, A&A, 396, 857 [NASA ADS] [CrossRef] [EDP Sciences] [Google Scholar]
- De Young, D. S., Roberts, M. S., & Saslaw, W. C. 1973, ApJ, 185, 809 [NASA ADS] [CrossRef] [Google Scholar]
- Emonts, B. H. C., Morganti, R., Struve, C., et al. 2010, MNRAS, 406, 987 [NASA ADS] [Google Scholar]
- Evans, D. A., Hardcastle, M. J., Croston, J. H., Worrall, D. M., & Birkinshaw, M. 2005, MNRAS, 359, 363 [NASA ADS] [CrossRef] [Google Scholar]
- Fanaroff, B. L., & Riley, J. M. 1974, MNRAS, 167, 31 [NASA ADS] [CrossRef] [Google Scholar]
- Ferrarese, L., & Ford, H. C. 1999, ApJ, 515, 583 [NASA ADS] [CrossRef] [Google Scholar]
- Flaquer, B. O., Leon, S., Combes, F., & Lim, J. 2010, A&A, 518, A9 [NASA ADS] [CrossRef] [EDP Sciences] [Google Scholar]
- Gupta, N., Salter, C. J., Saikia, D. J., Ghosh, T., & Jeyakumar, S. 2006, MNRAS, 373, 972 [NASA ADS] [CrossRef] [Google Scholar]
- Hardcastle, M. J., Evans, D. A., & Croston, J. H. 2009, MNRAS, 396, 1929 [NASA ADS] [CrossRef] [Google Scholar]
- Jaffe, W., & McNamara, B. R. 1994, ApJ, 434, 110 [NASA ADS] [CrossRef] [Google Scholar]
- Lynds, R. 1970, ApJ, 159, L151 [NASA ADS] [CrossRef] [Google Scholar]
- Minkowski, R. 1957, Radio astronomy, 4, 107 [Google Scholar]
- Morganti, R., Oosterloo, T. A., Tadhunter, C. N., et al. 2001, MNRAS, 323, 331 [NASA ADS] [CrossRef] [Google Scholar]
- Morganti, R., Oosterloo, T. A., Emonts, B. H. C., van der Hulst, J. M., & Tadhunter, C. N. 2003, ApJ, 593, L69 [NASA ADS] [CrossRef] [Google Scholar]
- Morganti, R., Peck, A. B., Oosterloo, T. A., et al. 2009, A&A, 505, 559 [NASA ADS] [CrossRef] [EDP Sciences] [Google Scholar]
- Oosterloo, T., Morganti, R., & Sadler, E. 1999, ASPC, 163, 72 [NASA ADS] [Google Scholar]
- Predehl, P., & Schmitt, J. H. M. M. 1995, A&A, 293, 889 [NASA ADS] [Google Scholar]
- Rubin, V. C., Oort, J. H., Ford, W. K., & Peterson, C. J. 1977, ApJ, 211, 693 [NASA ADS] [CrossRef] [Google Scholar]
- Sadler, E. M., Jenkins, C. R., & Kotanyi, C. G. 1989, MNRAS, 240, 591 [NASA ADS] [Google Scholar]
- van der Hulst, J. M., Golisch, W. F., & Haschick, A. D. 1983, ApJ, 264, L37 [NASA ADS] [CrossRef] [Google Scholar]
- van Gorkom, J. H., Knapp, G. R., Raimond, E., Faber, S. M., & Gallagher, J. S. 1986, AJ, 91, 791 [NASA ADS] [CrossRef] [Google Scholar]
- van Gorkom, J. H., Knapp, G. R., Ekers, R. D., Laing, R. A., & Polk, K. S. 1989, AJ, 97, 708 [NASA ADS] [CrossRef] [Google Scholar]
- Verdoes-Kleijn, G., Baum, S. A., de Zeeuw, P. T., & O’Dea, C. P. 2002, AJ, 123, 1334 [NASA ADS] [CrossRef] [Google Scholar]
- Vermeulen, R. C., Pihlström, Y. M., Tschager, W., et al. 2003, A&A, 404, 861 [NASA ADS] [CrossRef] [EDP Sciences] [Google Scholar]
All Tables
VLA sample description (Cols. 1 through 6) and observational results (Cols. 7 through 10).
H I and optical properties of the sample, split in H I detections and non-detections.
All Figures
|
Fig. 1 Plot of the continuum subtracted spectra for two of the detected sources from the VLA sample. The dashed vertical line indicates the systemic velocity. The x-axis is in optical barycentric velocity. The spectra are obtained against the brightest part of the radio source, which in both of these cases corresponds to the core. |
| In the text | |
|
Fig. 2 Plot of the H I absorption detected in IC 1459 with the ATCA telescope. For comparison with the VLA spectra, the plot has been smoothed to a velocity resolution of 40 km s-1. |
| In the text | |
|
Fig. 3 Histograms of the distributions of dust (a) and optical cores (b) in the H I detections and non-detections. |
| In the text | |
|
Fig. 4 Distribution of H I column density for the sample. The detections are grey, the detections with an optical core are hatched. Within the detections there is a clear trend for the sources without an optical core to have a higher H I column density. This is reflected in the entire sample, taking into account that the non-detections in the white area only have upper limits of H I column density and all have an optical core. |
| In the text | |
Current usage metrics show cumulative count of Article Views (full-text article views including HTML views, PDF and ePub downloads, according to the available data) and Abstracts Views on Vision4Press platform.
Data correspond to usage on the plateform after 2015. The current usage metrics is available 48-96 hours after online publication and is updated daily on week days.
Initial download of the metrics may take a while.