Fig. 4
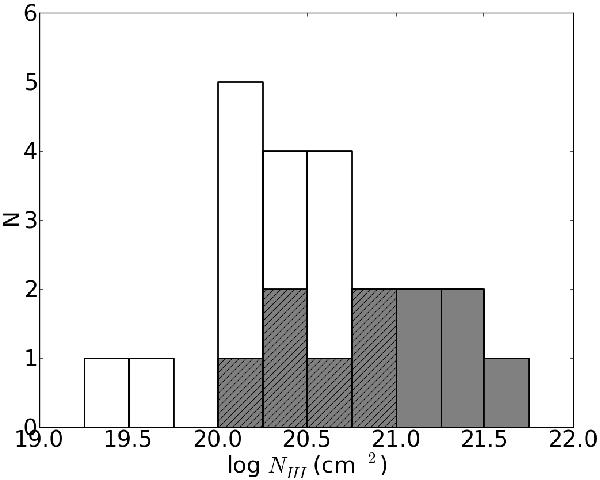
Distribution of H I column density for the sample. The detections are grey, the detections with an optical core are hatched. Within the detections there is a clear trend for the sources without an optical core to have a higher H I column density. This is reflected in the entire sample, taking into account that the non-detections in the white area only have upper limits of H I column density and all have an optical core.
Current usage metrics show cumulative count of Article Views (full-text article views including HTML views, PDF and ePub downloads, according to the available data) and Abstracts Views on Vision4Press platform.
Data correspond to usage on the plateform after 2015. The current usage metrics is available 48-96 hours after online publication and is updated daily on week days.
Initial download of the metrics may take a while.