Fig. 3
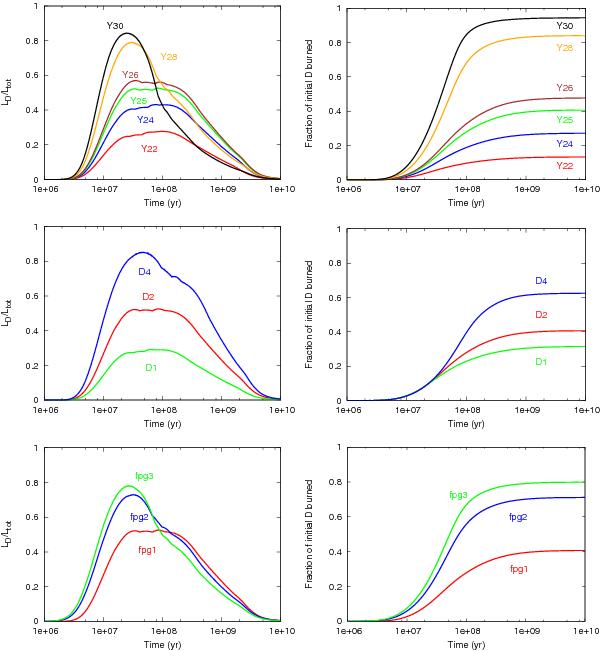
Left column: the ratio LD/Ltot. Right column: the depletion of deuterium. The first row shows our results for different helium abundances, the second row shows the influence of different deuterium abundances and the last row shows different dust-to-gas ratios (as defined in Table 2). The mass of all objects is 13 MJ (hot start). The run names corresponding to the individual lines are indicated in the plot.
Current usage metrics show cumulative count of Article Views (full-text article views including HTML views, PDF and ePub downloads, according to the available data) and Abstracts Views on Vision4Press platform.
Data correspond to usage on the plateform after 2015. The current usage metrics is available 48-96 hours after online publication and is updated daily on week days.
Initial download of the metrics may take a while.