Free Access
Fig. 8
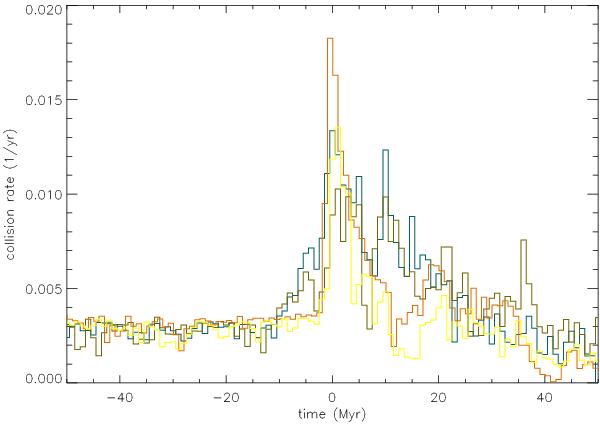
Cloud particle collision rate for the simulations described in Table 3. Red: simulation 18; blue: simulation 19; yellow: simulation 20; green: simulation 21.
Current usage metrics show cumulative count of Article Views (full-text article views including HTML views, PDF and ePub downloads, according to the available data) and Abstracts Views on Vision4Press platform.
Data correspond to usage on the plateform after 2015. The current usage metrics is available 48-96 hours after online publication and is updated daily on week days.
Initial download of the metrics may take a while.