Fig. 5
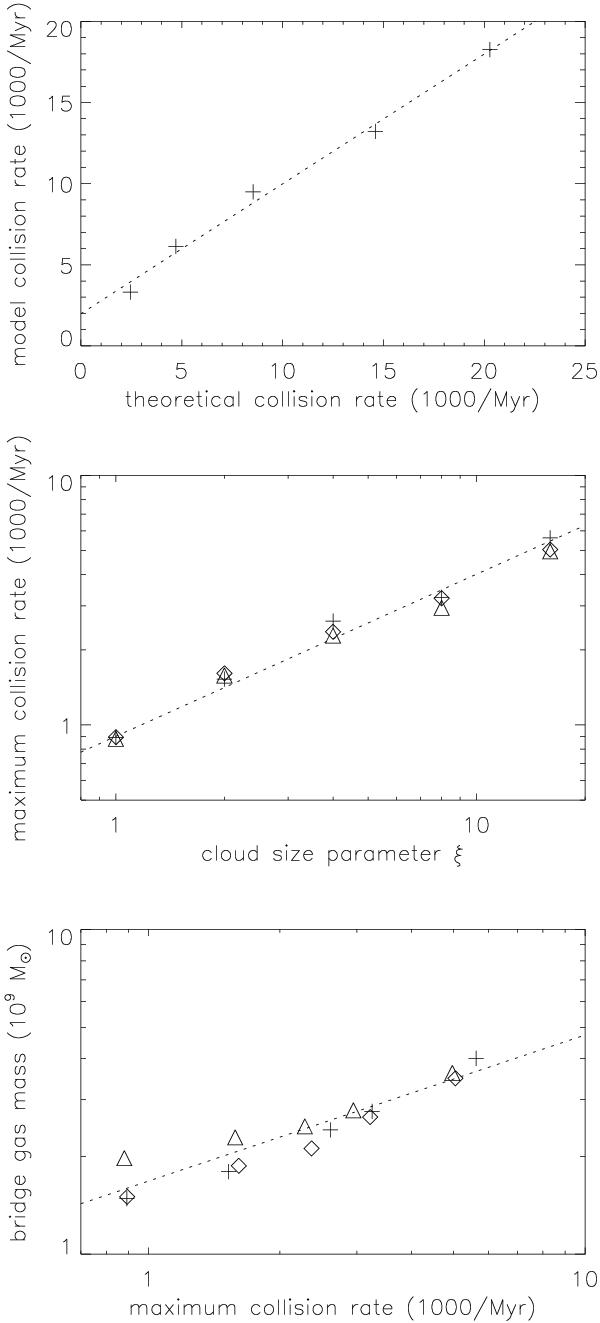
Correlation for the simulations described in Table 2. Upper panel: cloud collision rate of the simulated quiet galaxies before collision as a function of the theoretical cloud collision rate based on Eq. (3). Middle panel: maximum collision rate in bins of 10 Myr as a function of the cloud particle mass-size relation ξ. Lower panel: total gas mass in the bridge region as a function of the maximum collision rate. Crosses: i = 0°; diamonds: i = 30°; triangles: i = 45°.
Current usage metrics show cumulative count of Article Views (full-text article views including HTML views, PDF and ePub downloads, according to the available data) and Abstracts Views on Vision4Press platform.
Data correspond to usage on the plateform after 2015. The current usage metrics is available 48-96 hours after online publication and is updated daily on week days.
Initial download of the metrics may take a while.