Fig. 2
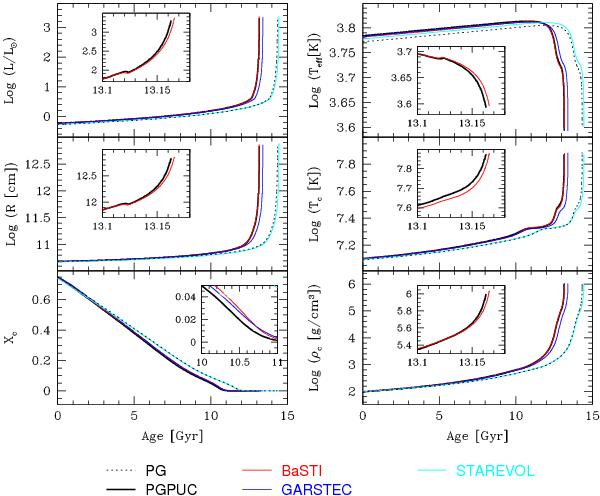
Comparison of some evolutionary properties for a 0.8 M⊙ star with Y = 0.250 and Z = 0.001, as predicted by some of the codes presented in Table 2: PG, dotted black lines; PGPUC, black lines; BaSTI, red lines; GARSTEC, blue lines; STAREVOL, cyan lines. The properties are luminosity (L/L⊙), effective temperature (Teff), radius (R), central temperature (Tc), density (ρc), and hydrogen abundance (XC). Small boxes are zoom-in to show the small differences between BaSTI and PGPUC results.
Current usage metrics show cumulative count of Article Views (full-text article views including HTML views, PDF and ePub downloads, according to the available data) and Abstracts Views on Vision4Press platform.
Data correspond to usage on the plateform after 2015. The current usage metrics is available 48-96 hours after online publication and is updated daily on week days.
Initial download of the metrics may take a while.