Fig. 5
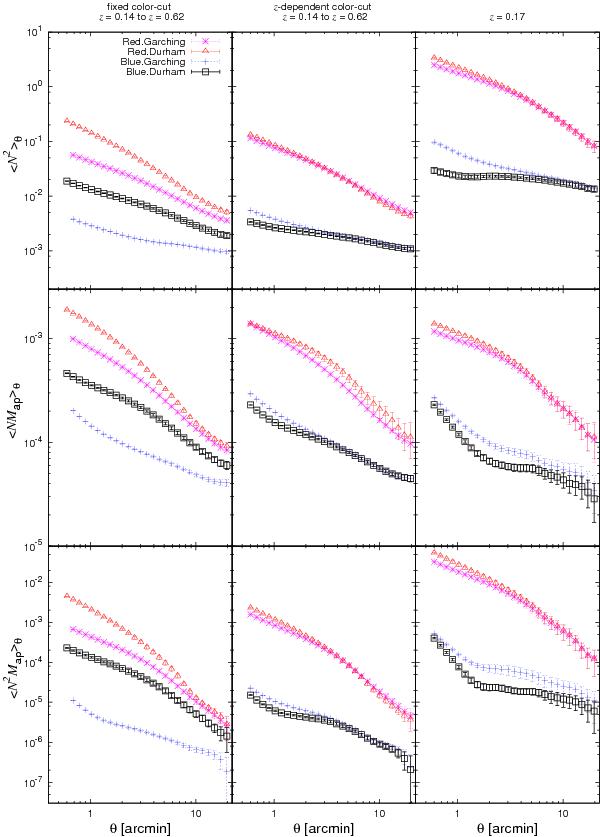
Aperture statistics for samples of red and blue galaxies in the Garching and Durham models. The left column shows the results for a fixed color-cut at u − r = 2.2 for galaxies with redshift between z = 0.14 and z = 0.62. The middle column displays the signals for galaxies between z = 0.14 and z = 0.62 separated using a redshift-dependent color cut. In the right column, galaxies are restricted to come from a single snapshot at redshift z = 0.17; accordingly error bars are larger.
Current usage metrics show cumulative count of Article Views (full-text article views including HTML views, PDF and ePub downloads, according to the available data) and Abstracts Views on Vision4Press platform.
Data correspond to usage on the plateform after 2015. The current usage metrics is available 48-96 hours after online publication and is updated daily on week days.
Initial download of the metrics may take a while.