Fig. 1
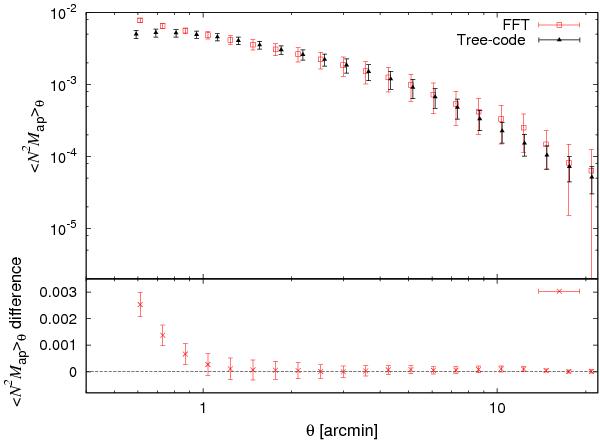
Upper panel: aperture statistics  as a function of filter scale θ measured in the Garching model. The FFT method (squares) and the tree method (triangles) are compared for lenses at redshift z = 0.17 with mr ≤ 22.5, stellar masses M⋆ ≥ 109 h-1 M⊙ and convergence field of sources at redshift z = 0.99. Error bars indicate the standard deviation of for aperture radius θ estimated across 32 fields. Lower panel: average difference signal between the FFT method and the tree method. Again the error bars show the standard deviation of the mean (field variance of difference signal divided by
  ).
).
Current usage metrics show cumulative count of Article Views (full-text article views including HTML views, PDF and ePub downloads, according to the available data) and Abstracts Views on Vision4Press platform.
Data correspond to usage on the plateform after 2015. The current usage metrics is available 48-96 hours after online publication and is updated daily on week days.
Initial download of the metrics may take a while.