Fig. 19
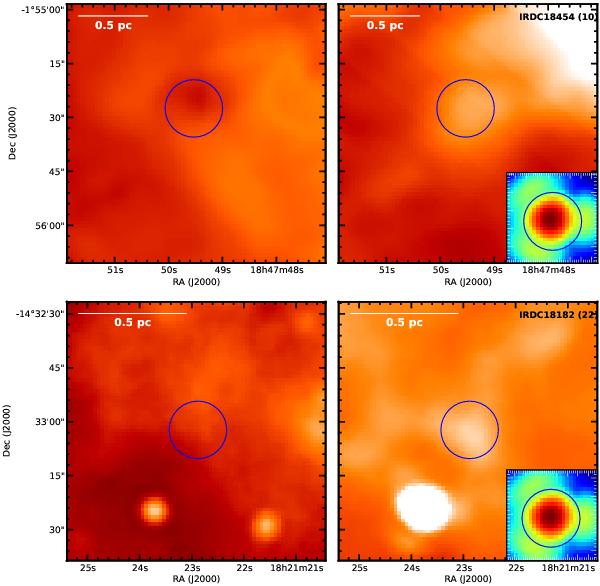
Left panels show the MIPS 24 μm image and the right panels show the PACS 100 μm image of the most massive cores with no 24 μm counterparts which are listed in Table 2. The top row is core 10 in IRDC18454 (estimated 138 M⊙), and the bottom row is core 22 in IRDC18182 (estimated 89 M⊙). The psf of Herschel at 100 μm, rotated in the sense of the scan direction, is shown in the lower-right corner of the right-hand panels. The blue circles indicate the position of the massive core in both the MIPS 24 μm and PACS 100 μm image.
Current usage metrics show cumulative count of Article Views (full-text article views including HTML views, PDF and ePub downloads, according to the available data) and Abstracts Views on Vision4Press platform.
Data correspond to usage on the plateform after 2015. The current usage metrics is available 48-96 hours after online publication and is updated daily on week days.
Initial download of the metrics may take a while.