Fig. 7
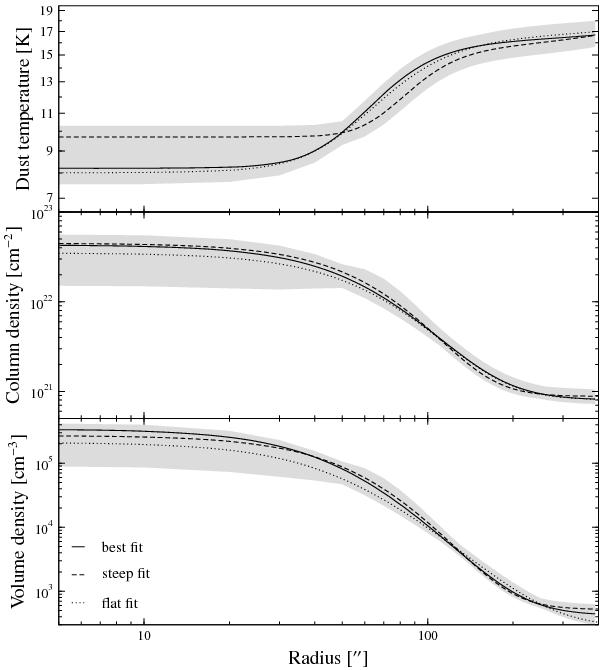
Visualisation of the ray-tracing fitting to the B68 data according to Table 3. We show the functional relations we used for fitting the LoS distributions of the dust temperature and the volume density that cover the range of valid solutions for each of the modelled quantities. The column density is the result of the integration of modelled volume densities along the LoS. The shaded areas represent the modelled range of values including the uncertainties of the fitting algorithm. Only the best fits (solid lines) are used to create the maps that show the dust temperature, the column density, and the volume density distributions.
Current usage metrics show cumulative count of Article Views (full-text article views including HTML views, PDF and ePub downloads, according to the available data) and Abstracts Views on Vision4Press platform.
Data correspond to usage on the plateform after 2015. The current usage metrics is available 48-96 hours after online publication and is updated daily on week days.
Initial download of the metrics may take a while.