Fig. 3
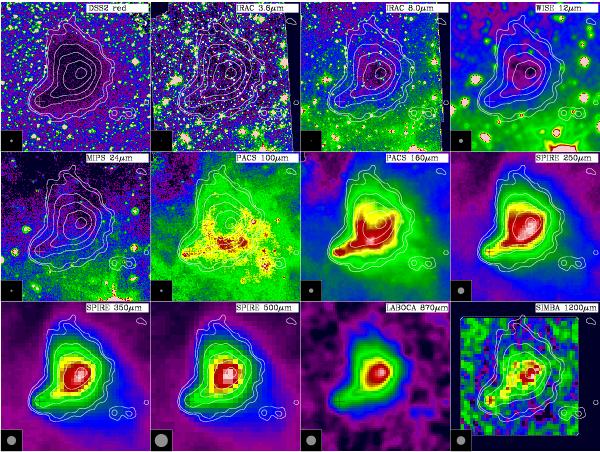
Image gallery of B68 Herschel and archival data covering a wide range of wavelengths. The instruments and wavelengths at which the images were obtained are indicated in the white annotation boxes. Each image has an arbitrary flux density scale, whose settings are given in Table 2. They were chosen to facilitate a comparison of the morphology. The maps are centred on RA = 17h22m39s, Dec = 23°50′00″ and have a field of view of 7′ × 7′. All coordinates in this manuscript are based on the J2000.0 reference frame. The corresponding beam sizes are indicated in the inserts. Contours of the LABOCA data obtained at λ = 870 μm show flux densities of 30, 50, 150, 250, 350, and 450 mJy/beam and are superimposed for comparison. The black and white crosses indicate the position of the point source at the tip of the trunk.
Current usage metrics show cumulative count of Article Views (full-text article views including HTML views, PDF and ePub downloads, according to the available data) and Abstracts Views on Vision4Press platform.
Data correspond to usage on the plateform after 2015. The current usage metrics is available 48-96 hours after online publication and is updated daily on week days.
Initial download of the metrics may take a while.