Fig. 6
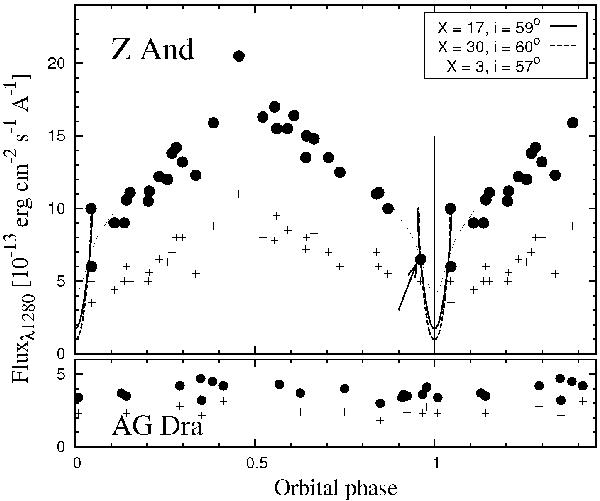
Variation in the far-UV, 1280 Å (•) and 1600 Å (+ ) fluxes of Z And and AG Dra along their orbits as measured on the IUE spectra during their quiescent phases. The arrow points the flux from the spectrum in Fig. 1. The lines around φ = 0 and 1 represent Rayleigh attenuated light curves for models in keys. Orbital elements of Fekel et al. (2000b) were used.
Current usage metrics show cumulative count of Article Views (full-text article views including HTML views, PDF and ePub downloads, according to the available data) and Abstracts Views on Vision4Press platform.
Data correspond to usage on the plateform after 2015. The current usage metrics is available 48-96 hours after online publication and is updated daily on week days.
Initial download of the metrics may take a while.