Fig. 5
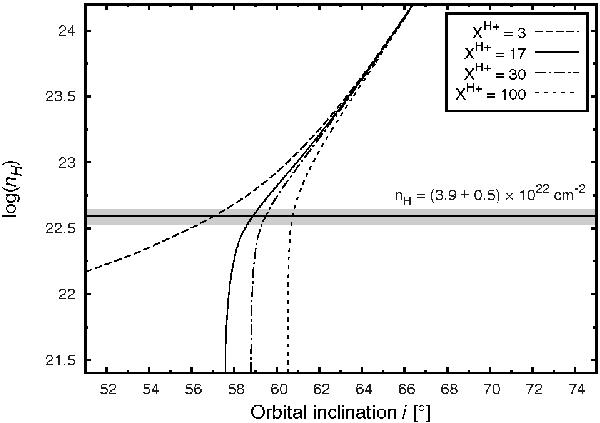
As in the bottom panel of Fig. 4, but for nH(i,φ = 0.961) as a function of i. Solution for XH+ = 100 was added to demonstrate the small change of i for very high XH+ (Sect. 4.1). Intersections of the model curves with the horizontal line at the observed value of nH = 3.9 × 1022 cm-2 correspond to i = 57, 59, 59.5, and 60 7. The shadow band represents the uncertainty in the measured nH.
Current usage metrics show cumulative count of Article Views (full-text article views including HTML views, PDF and ePub downloads, according to the available data) and Abstracts Views on Vision4Press platform.
Data correspond to usage on the plateform after 2015. The current usage metrics is available 48-96 hours after online publication and is updated daily on week days.
Initial download of the metrics may take a while.