Free Access
Fig. 5
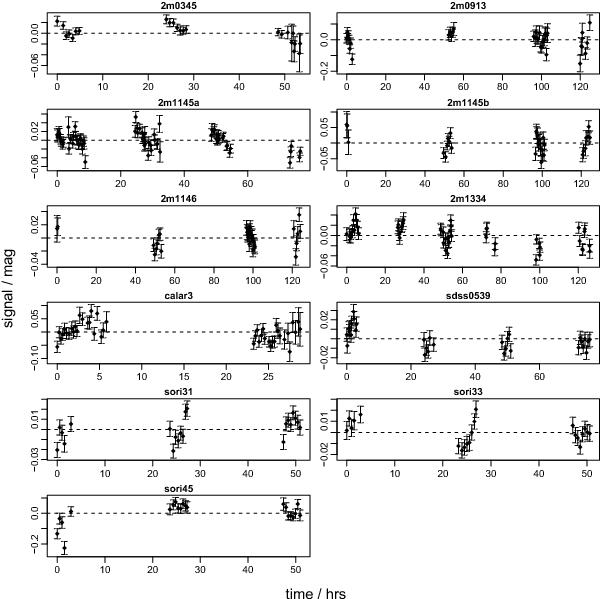
Ultra cool dwarf light curves, showing the variation in brightness over time. Note that increases in brightness are downwards in the y axis (more negative magnitudes). 2m1145a and 2m1145b are light curves of the same object, but observed more than a year apart.
Current usage metrics show cumulative count of Article Views (full-text article views including HTML views, PDF and ePub downloads, according to the available data) and Abstracts Views on Vision4Press platform.
Data correspond to usage on the plateform after 2015. The current usage metrics is available 48-96 hours after online publication and is updated daily on week days.
Initial download of the metrics may take a while.