Fig. 9
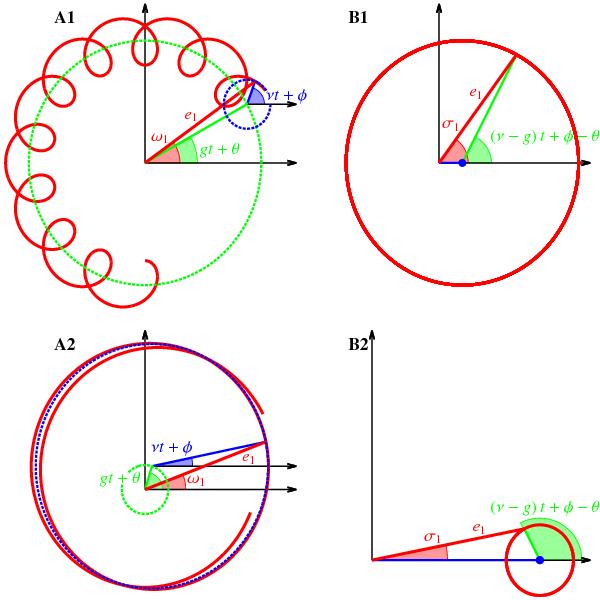
Illustration of the artificial libration of the resonant angles. We plot the evolution of the complex variables e1eiω1 (A1, A2) and e1eiσ1 (B1, B2) in the case of a strong secular eigenmode (A1, B1) and in the case of a severely damped one (A2, B2). For the sake of simplicity, we suppose that there is only one secular eigenmode (of frequency g), but the reasoning would be the same with more. We also suppose that there is only one high frequency term, corresponding to the nearest first order resonance, and whose frequency is ν = (p + 1)n2 − pn1. The secular contribution is plotted in green in all graphs whereas the high frequency term contribution is plotted in blue. The red curves correspond to the sums of both contributions. When there is a strong secular eigenmode, the high frequency term only brings small perturbations around the secular evolution of the argument of periastron ω1 (A1) and the resonant angle σ1 (B1) which circulates. When the eigenmode is damped, the evolution of ω1 (A2) and σ1 (B2) are dominated by the high frequency ν. The amplitude corresponding to ν does not change between A1, B1 and A2, B2 (the scale changes) but in B2 σ1 appears to librate because the circulation center (marked with a blue dot in B1, B2) is not at zero.
Current usage metrics show cumulative count of Article Views (full-text article views including HTML views, PDF and ePub downloads, according to the available data) and Abstracts Views on Vision4Press platform.
Data correspond to usage on the plateform after 2015. The current usage metrics is available 48-96 hours after online publication and is updated daily on week days.
Initial download of the metrics may take a while.