Fig. C.1
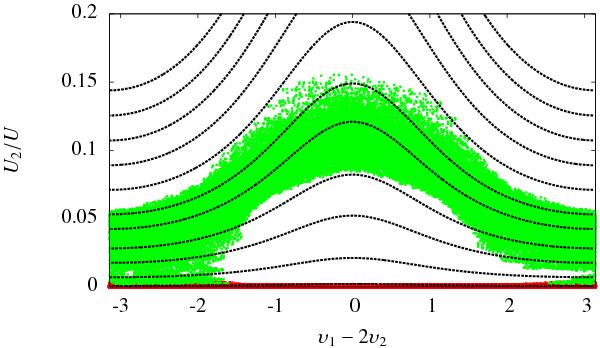
Superposition of the trajectory of the system S2 during the event (around t = 1.4 Myr) with the energy levels curves of the 2:1 resonance between both proper modes around the ACR solution. The successive positions of the system just before the event are marked with red dots while the positions of the system just after the event are marked with green dots.
Current usage metrics show cumulative count of Article Views (full-text article views including HTML views, PDF and ePub downloads, according to the available data) and Abstracts Views on Vision4Press platform.
Data correspond to usage on the plateform after 2015. The current usage metrics is available 48-96 hours after online publication and is updated daily on week days.
Initial download of the metrics may take a while.