Fig. 17
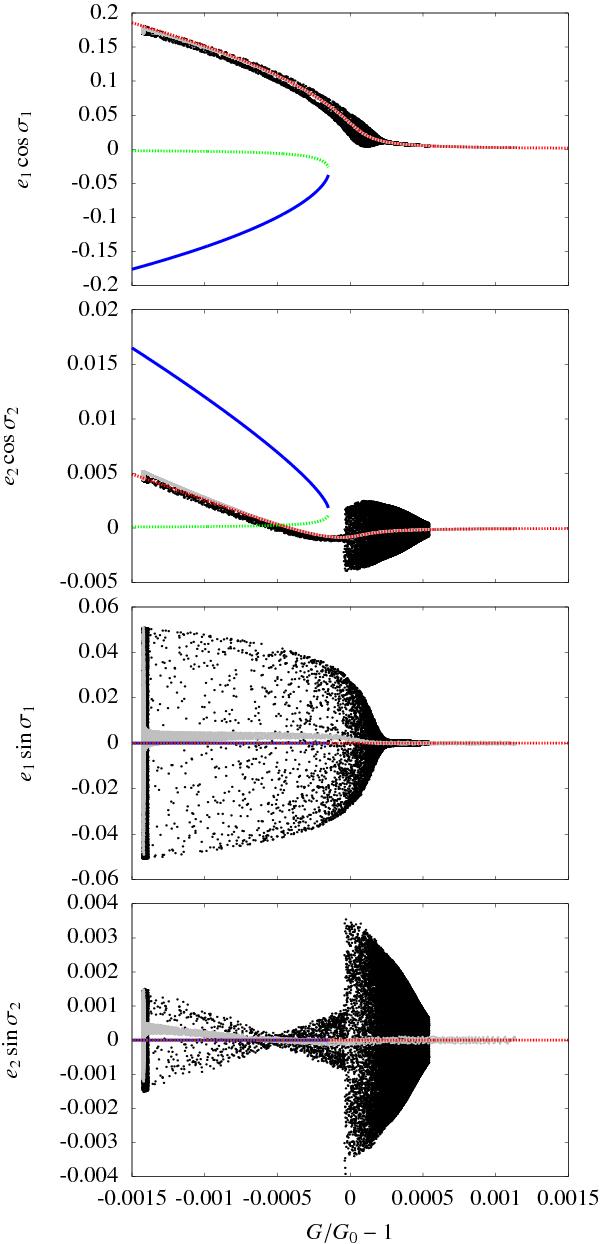
Superposition of the successive positions of the system in simulation S2 over the 2:1 ACR positions as functions of G. ACR positions are computed using our model with the parameters of the considered system (masses). The colors of ACR are consistent with graphs of Sect. 2 but we inverted continuous and dashed lines in order to improve the visibility of the simulation dots. The gray dots correspond to the migration phase and go from the right to the left of the graph whereas the black ones correspond to the tidal circularization phase and go from the left to the right.
Current usage metrics show cumulative count of Article Views (full-text article views including HTML views, PDF and ePub downloads, according to the available data) and Abstracts Views on Vision4Press platform.
Data correspond to usage on the plateform after 2015. The current usage metrics is available 48-96 hours after online publication and is updated daily on week days.
Initial download of the metrics may take a while.