Fig. 15
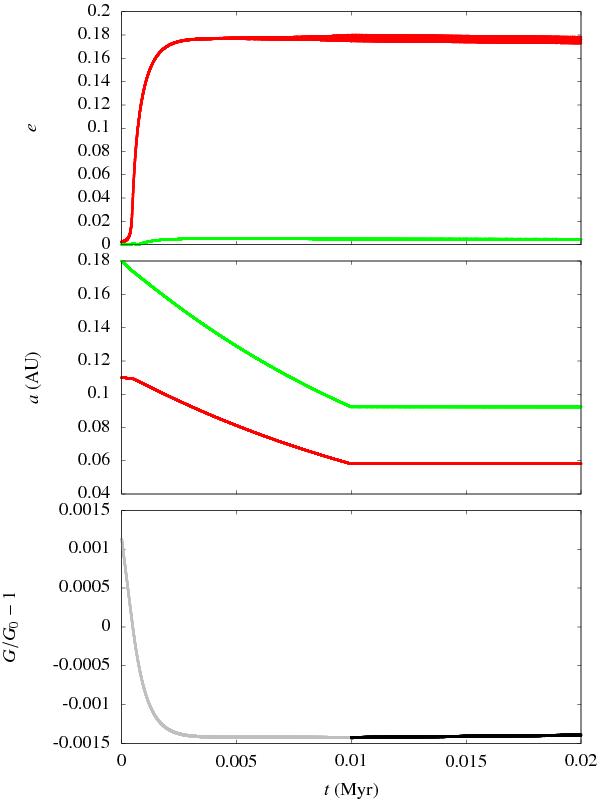
Evolution of the eccentricities (top) the semi-major axes (middle) and the parameter G (bottom) during the first 20 kyr of simulation S2. The red curves correspond to planet 1. The green curves correspond to planet 2. The gray part of the G curve (bottom) corresponds to the migration phase whereas the black part corresponds to the tidal circularization phase.
Current usage metrics show cumulative count of Article Views (full-text article views including HTML views, PDF and ePub downloads, according to the available data) and Abstracts Views on Vision4Press platform.
Data correspond to usage on the plateform after 2015. The current usage metrics is available 48-96 hours after online publication and is updated daily on week days.
Initial download of the metrics may take a while.