| Issue |
A&A
Volume 546, October 2012
|
|
|---|---|---|
| Article Number | A46 | |
| Number of page(s) | 11 | |
| Section | Astrophysical processes | |
| DOI | https://doi.org/10.1051/0004-6361/201219961 | |
| Published online | 02 October 2012 | |
Nonthermal processes and neutrino emission from the black hole GRO J0422+32 in a bursting state
1
Instituto Argentino de Radioastronomía (IAR CCT La Plata, CONICET),
C.C.5, (1984) Villa Elisa,
Buenos Aires,
Argentina
e-mail: This email address is being protected from spambots. You need JavaScript enabled to view it.
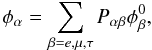
2
Facultad de Ciencias Astronómicas y Geofísicas, Universidad
Nacional de La Plata, Paseo del
Bosque s/n, 1900
La Plata,
Argentina
3
Departament d’Astronomia i Meteorologia, Institut de Ciències del
Cosmos (ICC), Universitat de Barcelona (IEEC-UB), Martí i Franquès 1, 08028
Barcelona,
Spain
Received:
6
July
2012
Accepted:
22
August
2012
Abstract
Context. GRO J0422+32 is a member of the class of low-mass X-ray binaries (LMXBs). It was discovered during an outburst in 1992. During the entire episode a persistent power-law spectral component extending up to ~1 MeV was observed, which suggests that nonthermal processes should have occurred in the system.
Aims. We study relativistic particle interactions and the neutrino production in the corona of GRO J0422+32, and explain the behavior of GRO J0422+32 during its recorded flaring phase.
Methods. We have developed a magnetized corona model to fit the spectrum of GRO J0422+32 during the low-hard state. We also estimate neutrino emission and study the detectability of neutrinos with 1 km3 detectors, such as IceCube.
Results. The short duration of the flares (~hours) and an energy cutoff around a few TeV in the neutrino spectrum make neutrino detection difficult. There are, however, many factors that can enhance neutrino emission.
Conclusions. The northern-sky coverage and full duty cycle of IceCube make it possible to detect neutrino bursts from objects of this kind through time-dependent analysis.
Key words: neutrinos / X-rays: binaries / radiation mechanisms: non-thermal
© ESO, 2012
1. Introduction
The transient source GRO J0422+32 was discovered during an outburst by the Burst And Transient Source Experiment (BATSE, which covered the 20–1000 keV band) onboard the Compton Observatory in 1992 (Paciesas et al. 1992). In only three days (August 5 to August 8), the intensity of the source rose from 0.2 Crab to 3 Crab in the 20–300 keV range (Paciesas et al. 1992). After the fast rise, the light curve showed an exponential decay on a timescale ~40 days. A secondary maximum ~140 days after the beginning of the outburst was reported by Harmon et al. (1992), which was also followed by an exponential decay. The entire episode lasted about 200 days (for a detailed description of the event see Ling & Wheaton 2003).
The outburst was also observed in UV/Optical/IR/Radio wavelengths (see, e.g., Castro-Tirado et al. 1993; Shrader et al. 1994; Callanan et al. 1996; Garcia et al. 1996). The features of the optical and UV spectra show that GRO J0422+32 is a member of the class of low-mass X-ray binaries (LMXBs), see Shrader et al. (1994). LMXBs usually undergo episodes where their X-ray luminosities increase in increments of up to several orders of magnitude. These episodes are thought to be produced by changes in the accretion rate onto a compact object. The outbursts typically last several months, as in the case of GRO J0422+32, although some can be as short as minutes, such as in V4641 Sgr, or as long as decades, as in GRS 1915+105, a source that has been active for the past 15 years and was quiescent before. Strong outbursts are recurrent, but LMXBs spend most of their lifetimes in quiescence (Shrader et al. 1994). Many of these sources do not go through a soft X-ray phase (Brocksopp et al. 2004), and the outbursts represent transitions from the quiescent to the hard X-ray state (Esin et al. 1998).
Including of GRO J0422+32 in the category of LMXBs is also supported by the detection of an optical counterpart by Castro-Tirado et al. (1993) during the outburst. The peak magnitude was V ~ 13.2, and subsequent measurements have shown that in quiescence the source dropped down to V = 22.4 (Zhao et al. 1994). Since the optical disk emission during outbursts overwhelms the light from the star (Sunyaev et al. 1993), the orbital parameters are estimated in the quiescent state. The optical spectrum during quiescence shows the secondary to be a normal M0/M2V dwarf star (Filippenko et al. 1995; Casares et al. 1995; Beekman et al. 1997).
The different measurements have yielded a wide range of estimates for the mass of the compact object. The mass function determined by several authors (Filippenko et al. 1995; Casares et al. 1995; Orosz & Bailyn 1995) is even consistent with the presence of a neutron star. Assuming that the contamination of the accretion disk in the infrared band is negligible, Callanan et al. (1996) estimated an orbital inclination of i ≤ 45° and a mass of ≥3.4 M⊙ for the compact object. Beekman et al. (1997), however, suggested that the earlier estimates were fuzzed by the contribution of the disk, and they estimated a lower limit of ~9 M⊙ for the compact object. This value strongly suggests there is a black hole in the system. More recently, Reynolds et al. (2007) have detected some flickering from the accretion disk and, when including these effects, obtained a mass ≥10 M⊙, which strongly supports the black hole nature of the compact object.
The black hole nature of GRO J0422+32 is also supported by its spectrum. The X and γ-ray spectra measured by several instruments can be characterized by an exponentially truncated power law, with a photon power law index of 1.49 ± 0.01 and a cut-off energy of 132 ± 2 keV (Sunyaev et al. 1993; Grove et al. 1998). This spectrum is similar to the low-hard state spectrum of Cygnus X-1 (Poutanen et al. 1997; McConnell et al. 2000), which is the most studied stellar black hole in our Galaxy.
The X-ray spectra of galactic black holes, such as GRO J0422+32 and Cygnus X-1, have been the subject of several studies. The disk-corona model, in which soft photons emitted by the disk gain energy by successive Compton upscatterings in a hot corona, has successfully explained the spectra below ~1 MeV (e.g., Poutanen & Svensson 1996; Narayan & Yi 1994). In addition, both GRO J0422+32 (Ling & Wheaton 2003) and Cygnus X-1 (McConnell et al. 2000) spectra show a persistent power law emission extended to ~1 MeV. This fact suggests that nonthermal processes must be taking place in these systems, as was studied by Li et al. (1996), Li & Miller (1997), and more recently by Belmont et al. (2008), Malzac & Belmont (2009), Vurm & Poutanen (2009), Romero et al. (2010b), and Vieyro & Romero (2012).
Several attempts have been made to detect high-energy gamma-rays and neutrinos from XRBs, which are unambiguous evidence of the presence of a population of very energetic particles. Gamma-ray emission from confirmed accreting black holes has been detected only during transient events of two of the most famous high-mass XRBs: Cygnus X-3, detected up to ~100 GeV by the AGILE satellite (Tavani et al. 2009) and by Fermi/LAT (Abdo et al. 2009), and an excess with a significance of 4.1σ after trial correction of Cygnus X-1 up to ~1 TeV in coincidence with an X-ray flare during its hard state (Albert et al. 2007). The intense radiation field of the companion star in both cases renders it difficult to detect gamma-rays above a few hundred GeV, owing to photon absorption in the stellar field. Neutrinos, on the other hand, could be the indication of very high-energy phenomena taking place in these objects, since they easily escape from the binary system. Several works have been devoted to studying the neutrino production in high-energy sources (e.g., Christiansen et al. 2006; Kappes et al. 2007), and current upper limits are at the level of ~8 × 10-11 TeV-1 cm-2 s-1 for sources with soft spectra or with an energy cutoff below the PeV scale (Odrowski 2011). The recent completion of IceCube presents a unique opportunity to test our models.
In the case of LMXBs, absorption of gamma-rays is absent, so these are particularly suitable objects for studying both the gamma-ray and neutrino production. In this work we apply a hybrid strongly magnetized plasma corona model (Vieyro & Romero 2012) to study the nonthermal processes and neutrino production during transient events of LMXBs. We use the source GRO J0422+32 as a prototype. Section 2 summarizes the basic properties of the source in the quiescent state and during the outburst. In Sect. 3.1 we briefly describe the model. Then, we study first the source in the steady state (Sect. 4), and in Sect. 5 we extend our model to encompass the possible enhanced emission of neutrinos and gamma-rays during a flare. Finally, in Sect. 7, we study the detectability of neutrinos from the source by making use of the latest performance studies of the IceCube neutrino detector (Odrowski & IceCube coll. 2012). Section 8 has the discussion.
2. The binary system GRO J0422+32
The system GRO J0422+32 is a binary system with a low-mass star and a possible black hole. It has an orbital period of 5.1 ± 0.01 h (Filippenko et al. 1995; Callanan et al. 1996). There is evidence that the system has a low inclination, ~10°−30° (Beekman et al. 1997). Based on a method that only depends on the spectral type of the companion star, Esin et al. (1998) estimated a distance to the source of 2.6 kpc, which is consistent with previous results (Shrader et al. 1994).
Using this estimate of distance and the X-ray absorption (Filippenko et al. 1995), the derived luminosity in the 0.5–10.0 keV band is 7.6 × 1030 erg s-1 for the quiescent state (Garcia et al. 2001). As expected for X-ray transients, the X-ray luminosity is several orders of magnitude higher during the outburst; in the 2–300 keV, the luminosity reaches 5 × 1037 erg s-1 (Sunyaev et al. 1993).
The X-ray spectrum of the source shows no evidence of an ultrasoft component. The column density is NH < 2 × 1021 cm2 (Callanan et al. 1996), which is too low a value to explain the absence of a soft component in the X-ray spectrum by absorption. This might indicate a peculiar orientation of the surface of the accretion disk with respect to the observer (Sunyaev et al. 1993).
During the outburst a flat radio emission was detected with the Very Large Array (Shrader et al. 1994), which is a signature of an expanding environment. These observations, however, did not reveal any jet-like structure. More recently, the new capabilities of the Expanded Very Large Array were used to reach noise levels as low as 2.6 μJy beam-1 and to study black hole X-ray binaries in the hard and quiescent states (Miller-Jones et al. 2011). GRO J0422+32 was not detected to a 3σ upper limit of 8.3 μJy beam-1. The lack of clear radio emission might indicate the absence of a relativistic jet, leaving the corona as the most likely region for producing the nonthermal high-energy emission observed in the source.
3. Basics of the model
3.1. Scenario
There are many similarities between the X-ray spectrum of GRO J0422+32 and Cygnus X-11. Then, it is reasonable to assume as a first approximation that the mechanism responsible for the hard X-ray/soft γ-ray emission might be the same in both systems (Ling & Wheaton 2003). To explain the nonthermal power law spectrum of GRO J0422+32 in the active state, we propose a model of a magnetized black hole corona (Vieyro & Romero 2012). Figure 1 shows a sketch of the main components of the system.
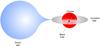 |
Fig. 1 Schematic representation of the components of the system discussed in the text. In the spherical corona, the thermal and nonthermal components are co spatial. Not to scale. |
We assume a spherical corona with a radius Rc and an accretion disk that penetrates the corona up to Rinn < Rc. In corona+disk models, the size of the emitting region can be constrained by considering some features of the spectrum. The transition radius between the hot corona and the soft photons emission region is estimated to be ~200 Rg (Esin et al. 1998), where Rg is the gravitational radius (Rg = GM/c2). We assume an inner radius for the disk of Rinn = 200 Rg. Typically the ratio between the inner radius of the disk and the corona radius is 0.9 (Poutanen 1998). Here, we adopt a corona radius of Rc = 220 Rg. We suppose that the corona is homogeneous and isotropic. First, we study the corona in a low-hard steady state, and in Sect. 5 we extend our model to the corona during the flare.
Since there is no information regarding the emission of the disk, we use the disk model for the low-mass binary XTE J1118+480 developed by Vila et al. (2012). The corresponding temperature of the accretion disk is ~0.08 keV. In a recent study of the ultraviolet spectra of galactic black holes in quiescence (Hynes & Robinson 2012), the estimated temperature of the accretion disk of GRO J0422+32 is considerably lower than the value adopted in our work. This result, however, does not disagree with our assumption. According to ADAF models of black hole coronae, the value of Rinn is lower in the low-hard state than the one in quiescence, so that the temperatures achieved by the accretion disk are higher and similar to the one adopted here for the low-hard state.
The hard X-ray emission of the corona is characterized by a power law with an exponential
cutoff at high energies:  (1)Using the data taken with
the Mir-Kvant observatory during the 1992 outburst, we fit the spectrum with a photon
index of ~1.49 and a cut-off energy Ec = 132 keV, as shown
in Fig. 2 (Sunyaev
et al. 1993; Grove et al. 1998). The
normalization constant Aph can be obtained from
Lc; at a distance of 2.6 kpc, the corona luminosity
is ~5 × 1037 erg s-1 (Sunyaev
et al. 1993). This value is equivalent to 5% of the Eddington luminosity of
a ~9 M⊙ black hole, which is the value for the mass
adopted in our model.
(1)Using the data taken with
the Mir-Kvant observatory during the 1992 outburst, we fit the spectrum with a photon
index of ~1.49 and a cut-off energy Ec = 132 keV, as shown
in Fig. 2 (Sunyaev
et al. 1993; Grove et al. 1998). The
normalization constant Aph can be obtained from
Lc; at a distance of 2.6 kpc, the corona luminosity
is ~5 × 1037 erg s-1 (Sunyaev
et al. 1993). This value is equivalent to 5% of the Eddington luminosity of
a ~9 M⊙ black hole, which is the value for the mass
adopted in our model.
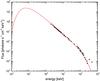 |
Fig. 2 The spectrum of GRO J0422+32 observed with instruments onboard the Mir-Kvant observatory, fitted with a power law of index 1.49 and an exponential cut-off 132 keV (Sunyaev et al. 1993). |
Main parameters of the model.
We assume that the corona consists of a two-temperature plasma, with an electron temperature Te = 109 K and an ion temperature Ti = 1012 K (Narayan & Yi 1995a,b). The values of the main parameters are obtained by assuming equipartition of energy between the magnetic field, the bolometric luminosity of the corona and the kinetic energy of the plasma, as described in Vieyro & Romero (2012). Table 1 summarizes the values of the different parameters derived or assumed for GRO J0422+32.
3.2. Particle acceleration and losses
We now consider the interaction of locally injected relativistic particles with the matter, photon, and magnetic fields of the corona and the disk, which are taken as background components. The relevant processes of interaction of relativistic particle are the following: interaction with the magnetic field producing synchrotron radiation; collisions with the corona plasma via relativistic Bremsstrahlung, for electrons and muons, and via hadronic inelastic collisions for protons and charged pions; and interactions with the photon fields through IC scattering (electrons and muons) and photomeson production (protons and charged pions). The photon fields considered initially as targets are the X-ray photon field of the corona and the field produced by the accretion disk; then, the nonthermal photons are added to the target field. The stellar field is not an efficient target (Vieyro & Romero 2012).
We also consider the injection of electron/positron pairs through three different channels: photopair production, Bethe-Heitler process, and muon decay. Pairs can also annihilate. Convenient expressions for the energy loss rates for all these processes can be found, e.g., in Vieyro & Romero (2012) and Vila & Aharonian (2009).
In Romero et al. (2010b), it is shown that in a corona dominated by advection most hadrons fall onto the black hole before cooling, thus the radiated luminosity is not sufficient to explain the nonthermal tail detected in galactic black holes. Then, we consider a static corona supported by magnetic fields (see Beloborodov 1999), where the relativistic particles can be removed by diffusion. In particular, we refer to static corona as those systems where the advection time scale is >10 s. This is the value expected in highly magnetized systems, much greater than those associated with advective corona where the mean radial velocity is the free-fall velocity, v ~ 0.1 c, and the advection time scale is on the order of 1 s (Romero et al. 2010b).
For a static corona, the diffusion rate is  (2)where
D(E) is the diffusion coefficient given by
D(E) = rgc/3
in the Bohm regime, and
rg = E/(eB)
is the giroradius of the particle.
(2)where
D(E) is the diffusion coefficient given by
D(E) = rgc/3
in the Bohm regime, and
rg = E/(eB)
is the giroradius of the particle.
The maximum energy that a relativistic particle can attain depends on the acceleration
mechanism and the different processes of energy loss. The acceleration rate
 for a particle of energy
E in a magnetic field B, is given by
for a particle of energy
E in a magnetic field B, is given by  (3)where
η ≤ 1 is a parameter that characterizes the efficiency of the
acceleration. According to a model of magnetic reconnection as an acceleration mechanism,
the acceleration efficiency can be obtained by (del Valle
et al. 2011)
(3)where
η ≤ 1 is a parameter that characterizes the efficiency of the
acceleration. According to a model of magnetic reconnection as an acceleration mechanism,
the acceleration efficiency can be obtained by (del Valle
et al. 2011)  (4)where
vrec is the reconnection speed, which has a value similar to
the Alfvén speed in violent reconnection events. In a corona characterized with the
parameters of Table 1, the Alfvén speed
is ~0.5 c (de Gouveia dal Pino
& Lazarian 2005), yielding an acceleration efficiency of
η ~ 0.08. We note that the acceleration mechanism is not included as an
energy loss term in the transport equation, so it is only used to determine the injection
function of primary electrons and protons.
(4)where
vrec is the reconnection speed, which has a value similar to
the Alfvén speed in violent reconnection events. In a corona characterized with the
parameters of Table 1, the Alfvén speed
is ~0.5 c (de Gouveia dal Pino
& Lazarian 2005), yielding an acceleration efficiency of
η ~ 0.08. We note that the acceleration mechanism is not included as an
energy loss term in the transport equation, so it is only used to determine the injection
function of primary electrons and protons.
Figure 3 shows the cooling rates for different energy-loss processes, together with the acceleration and escape rates, for each type of particle considered.
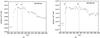 |
Fig. 4 Flux histories detected with BATSE in the energy bands 100–200 keV (left panel) and 200–300 keV (right panel). The data is from Ling & Wheaton (2003). The plateau phase is the period of ~15 days between TJD ~ 8 845 and TJD ~ 8 860. Lines (b) and (c) correspond to TJD 8 848 and 8 855, respectively, where the two first maxima at E < 200 keV were detected; in an analogous way, lines (a) and (d) correspond to TJD 8 843 and 8 862, where the two first maxima at E > 200 keV were detected. |
Under the physical conditions previously described, the main channels of energy loss for electrons are IC scattering and synchrotron radiation. For protons, both pp and pγ interactions are relevant. Charged pions decay before cooling, which leads to the production of energetic muons and neutrinos. The diffusion has almost no effect on the various particle distributions.
The maximum energies obtained by electrons and protons are
 GeV and
 eV, respectively.
These values are compatible with the Hillas criterion, given the size of the corona (Hillas 1984). With these values, high-energy protons
may lead to the production of neutrinos of energies above 0.1 TeV, which is the current
IceCube detection threshold.
eV, respectively.
These values are compatible with the Hillas criterion, given the size of the corona (Hillas 1984). With these values, high-energy protons
may lead to the production of neutrinos of energies above 0.1 TeV, which is the current
IceCube detection threshold.
4. Spectral energy distributions
In Ling & Wheaton (2003) a detailed analysis of the outburst of GRO J0422+32 is presented, showing that the spectrum of the source changed its shape along the episode. At the beginning, the spectrum can be described by a simple power law of index α ~ 1.75 (flux ∝ E−α), and then it clearly shows two components, a thermal component plus a high energy power law with a variable index (Ling & Wheaton 2003).
The variations in the spectrum might reflect changes in the injection function of the relativistic particles. We applied our model to reproduce the spectrum during the plateau phase of the event, associated with the low-hard state. The plateau phase can be seen in Fig. 4 around the peak of the luminosity (TJD ~ 8 850). We selected the observations made with BATSE on TJD 8 843 to fit the spectrum, given that these are the data with smaller observational errors.
Ling & Wheaton (2003) also detected time- and energy-dependent flux variability, and obtained different temporal features for different energy bands. For example, in Fig. 4 lines (b) and (c) show the first two maxima in the energy band 35–200 keV, whereas lines (a) and (d) indicate the first two maxima detected at energies above 200 keV.
To obtain the particle distributions and to compute the spectral energy distribution (SED), we implement a consistent treatment of nonthermal emission in the magnetized corona (Vieyro & Romero 2012). This method solves the set of coupled differential equations for all kinds of particles through an iterative scheme.
The injection function for nonthermal protons and electrons is a power law of the energy of
the particles given by  (5)as a consequence of
multiple, fast, magnetic reconnection events. Following de
Gouveia dal Pino & Lazarian (2005), we adopt a standard index
α = 2.2 (see, nonetheless, Drury
2012, for critics and alternatives). The normalization constant
Q0 can be obtained from the total power injected in
relativistic protons and electrons,
Lrel = Lp + Le.
The power injected in relativistic particles is considered to be a fraction of the corona
luminosity
Lrel = qLc.
(5)as a consequence of
multiple, fast, magnetic reconnection events. Following de
Gouveia dal Pino & Lazarian (2005), we adopt a standard index
α = 2.2 (see, nonetheless, Drury
2012, for critics and alternatives). The normalization constant
Q0 can be obtained from the total power injected in
relativistic protons and electrons,
Lrel = Lp + Le.
The power injected in relativistic particles is considered to be a fraction of the corona
luminosity
Lrel = qLc.
The total power available to accelerate particles through magnetic reconnection in a
magnetized system can be estimated as in del Valle et al.
(2011),  (6)where
 , and
vA is the Alfvén velocity. In our model L
is ~15% Lc. The precise way in which power is divided between
hadrons and leptons is unknown, but different scenarios can be taken into account by setting
Lp = aLe. We
consider a model with a = 100 (proton-dominated scenario, as for Galactic
cosmic rays), where the high hadron content favors the neutrino production.
, and
vA is the Alfvén velocity. In our model L
is ~15% Lc. The precise way in which power is divided between
hadrons and leptons is unknown, but different scenarios can be taken into account by setting
Lp = aLe. We
consider a model with a = 100 (proton-dominated scenario, as for Galactic
cosmic rays), where the high hadron content favors the neutrino production.
In Fig. 5 we show the data of GRO J0422+32 in TJD 8843 fitted with the final SED obtained with our model. The best-fit value of the parameter q is 0.12; that is 12% of the total power available to accelerate particles through magnetic reconnection is injected in relativistic particles.
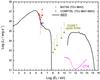 |
Fig. 5 Spectrum of GRO J0422+32 detected with BATSE (Ling & Wheaton 2003) and fitted with the spectral energy distribution obtained with a nonthermal corona model. The values of the free parameters in this adjustment are a = 100 and q = 0.12. |
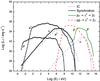 |
Fig. 6 Main contribution to the nonthermal luminosity. Internal absorption of the radiation is not included, but it has a strong impact on the final SED as shown in the previous figure. |
The synchrotron radiation of electron/positron pairs and protons dominates the spectrum at low energies; at energies ~106−8 eV, IC scattering of electron/positron pairs is also relevant. At high energies the main contribution is the decay of neutral pions produced in hadronic interactions (both pp and pγ).
In our model the internal absorption suppresses the emission completely for energies in the band 108 < E < 3 × 10¹⁰ eV. Unlike a jet-model, which yields emission in this energy range (Romero & Vila 2008), our result agrees with the non detection of GRO J0422+32 by EGRET (which was the instrument operating when the episode occurred, and covered the energy range ~100 MeV < E < 30 GeV). The values of the EGRET upper limits for GRO J0422+32 are from Levinson & Mattox (1996).
The luminosity of an M2V dwarf star during quiescence is ~1032 erg s-1 and the effective temperature is 3500 K (Reid et al. 1995). During the outburst, the optical magnitude of the companion star increased in 9 mag, which corresponds to a change in the luminosity >3 orders of magnitude. The maximum luminosity was 6 × 1035 erg s-1, and the peak of the emission appeared at 0.15 eV. On the one hand, the optical emission of the star during the outbursts was negligible in comparison with the disk emission (Sunyaev et al. 1993), and on the other, in order to create electron/positron pairs in the stellar field, the energy of the gamma photon should be >1015 eV, which is very unlikely according to our model. Then, the absorption in the stellar field was not relevant.
5. Flare
It is known that X-ray binaries undergo transient radiative flares (see, e.g., Stern et al. 2001; Mazets et al. 1996; Golenetskii et al. 2003; Albert et al. 2007; Tavani et al. 2009, for flare events in Cygnus X-1). In particular, within the first 80 days of the 1992 outburst of GRO J0422+32, four shorter but strong episodes were detected in the energy band 0.4–1 MeV (Ling & Wheaton 2003). In Fig. 4 lines (a) and (b) indicate the first two of these episodes. These are the flares that took place during the plateau phase of the main episode. The other two flares occurred when the corona luminosity decreased to half the peak level and 1/10 of the peak (i.e. at ~30 and ~80 days after the beginning of the outburst, respectively). Their contribution to neutrino emission is then negligible in comparison with the flares occurring in the plateau.
A possible cause of these events might be an increase in the power injected in relativistic
particles, owing to large-scale reconnection events. This suggestion is supported by
observations of solar flares where magnetic reconnection can trigger diffusive acceleration
(Tsuneta & Naito 1998; Lin 2008; Kowal et al.
2011). To represent a sudden injection of relativistic particles, we adopt the
following analytic expression (Romero et al. 2010a):
![Mathematical equation: \begin{eqnarray} Q(E,t) = &\, Q(E)\left(1-{\rm e}^{t/\tau_{\rm{rise}}} \right) \nonumber \\ & \,\times \left[ \frac{\pi}{2}- \arctan \left( \frac{t-\tau_{\rm{plat}}}{\tau_{\rm{dec}}} \right) \right], \end{eqnarray}](/articles/aa/full_html/2012/10/aa19961-12/aa19961-12-eq101.png) (7)where
τrise, τdec and
τplat are the rise, decay, and plateau duration, respectively.
Since BATSE spectra are daily, we consider flares of a duration of less than a day; we adopt
τrise = 30 min, τdec = 1 h, and
τplat = 2 h for a rapid flare.
(7)where
τrise, τdec and
τplat are the rise, decay, and plateau duration, respectively.
Since BATSE spectra are daily, we consider flares of a duration of less than a day; we adopt
τrise = 30 min, τdec = 1 h, and
τplat = 2 h for a rapid flare.
The energy dependence is the same as in the steady state, given by Eq. (5). The normalization constant Q0 is again obtained from the total power injected in relativistic protons and electrons. It is assumed that the thermal corona remains unaffected during the event. In our model, the power injected in the flare is 15% of the luminosity of the corona, which is equal to the total power available for accelerating particles via reconnection events. Such energetic flares are known from studies of solar flares (Lin 2008).
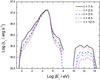 |
Fig. 7 Evolution of the luminosity during a flare of ~2 h of duration. Since the cooling time scales in the corona are significantly shorter than flare time scales, the shape of the spectrum does not change and just shows decreasing luminosity levels as the flare evolves. |
In Fig. 7 we show the evolution of the luminosity of the source along a span of 12 h. That the shape of the spectrum remains almost unaltered along the outburst can be explained as follows: cooling time scales in galactic black hole coronae are significantly shorter than flare time scales (typically of hours or even days, see e.g. Malzac & Jourdain 2000). Then, the system behaves as in the steady state, but shows decreasing luminosity levels as the flare evolves. The most noticeable changes occur at high energies. As in the steady state, the high-energy emission is due to hadronic interactions, and since we are considering a proton-dominated corona (a = 100), the increment in the power injected in relativistic particles (from 10% Lc in steady state to 15% Lc at the maximun of the outburst) can be directly seen as an increase in the luminosity (~0.5 order of magnitude) at energies above 10 GeV.
6. Neutrino emission
We are interested in estimating the νμ
production, since the searches for point-like neutrino emission make use of this neutrino
flavor. As explained in the following section, however, we also need to estimate the
production of all neutrino flavors in order to take the effects of neutrino oscillations
into account. Then, we consider νe production by the channel of
muon decay  (8)and
νμ production by the previous channel plus
charged pion decay
(8)and
νμ production by the previous channel plus
charged pion decay  (9)Thus, the total emissivity
of muon-neutrinos is (Reynoso & Romero 2009)
(9)Thus, the total emissivity
of muon-neutrinos is (Reynoso & Romero 2009)
 (10)where
 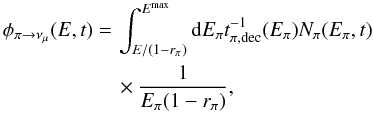 (11)with
rπ = (mμ/mπ)2
and
(11)with
rπ = (mμ/mπ)2
and ![Mathematical equation: \begin{eqnarray} \phi_{\mu \rightarrow \nu_{\mu}}(E,t) =\,& \sum^4_{i=1} \int^{E^{\rm{max}}}_{E} \frac{{\rm d}E_{\mu}}{E_{\mu}} t^{-1}_{\mu,\rm{ dec}}(E_{\mu})N_{\mu_{i}}(E_{\mu},t)\\ &\times \left[ \frac{5}{3}-3x^2+ \frac{4}{3}x^3 \right]. \nonumber \end{eqnarray}](/articles/aa/full_html/2012/10/aa19961-12/aa19961-12-eq115.png) (12)In
this expression,
x = E/Eμ,
(12)In
this expression,
x = E/Eμ,
 ,
and
,
and  .
.
In a similar way to Eq. (11), the total
emissivity of electron-neutrinos νe is (Lipari et al. 2007):
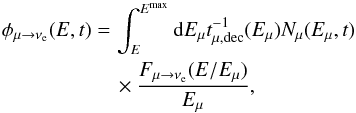 (13)where
 (14)for unpolarized muons.
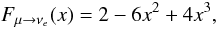
The third flavor of neutrino, ντ, can be
injected in astrophysical sources, for example, by a different channel of electron/ positron
annihilation:  (15)This channel,
however, takes place only at energies of the electrons and positrons
>100 GeV, but this channel does not occur in our model (see Fig.
3), so we consider a source with null production of
initial ντ.
(15)This channel,
however, takes place only at energies of the electrons and positrons
>100 GeV, but this channel does not occur in our model (see Fig.
3), so we consider a source with null production of
initial ντ.
6.1. Neutrino oscillations
Neutrinos from astrophysical sources detected on Earth travel long distances, and the
probability of neutrino oscillations depends on distance. Then the flux of neutrinos of a
given flavor can be affected by this effect. If we call
 to the
neutrino flux of flavor α at the source, then the arriving flux on Earth
is (Esmaili 2010)
to the
neutrino flux of flavor α at the source, then the arriving flux on Earth
is (Esmaili 2010)
 (16)where
Pαβ is the oscillation probability, and for
long distances to the source is given by
(16)where
Pαβ is the oscillation probability, and for
long distances to the source is given by
 (17)Here
Uαj is the mixing matrix. The current
best-fit parameters of the mixing matrix are listed in Table 2.
(17)Here
Uαj is the mixing matrix. The current
best-fit parameters of the mixing matrix are listed in Table 2.
Best fit for the mixing angles (Nakamura & Particle Data Group 2010).
One aim of our work is to predict what might be detected by IceCube if the source GRO J0422+32 flared as it did it in 1992. Since the effect of neutrino oscillations can change the flux of νμ estimated in Sect. 6, we correct it by applying the analysis described above.
The final values of the mixing matrix are taken from Vissani & Aharonian (2012), and the final neutrino flux results:
 Though
the precise values of the parameters depend on the analysis, the changes in the mixing
matrix are not very large (Vissani & Aharonian
2012).
Though
the precise values of the parameters depend on the analysis, the changes in the mixing
matrix are not very large (Vissani & Aharonian
2012).
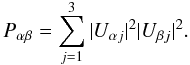
The differential flux of neutrinos arriving at the Earth can be obtained as
 (20)Figure 8 shows this quantity, weighted by the squared energy,
during the plateau phase (~15 days), and Fig. 9
shows the evolution of the neutrino flux in a flare event.
(20)Figure 8 shows this quantity, weighted by the squared energy,
during the plateau phase (~15 days), and Fig. 9
shows the evolution of the neutrino flux in a flare event.
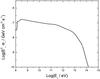 |
Fig. 8 Differential flux of muon neutrinos produced in the hard state of GRO J0422+32 arriving at the Earth. The effects of neutrino oscillations are included. |
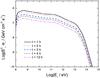 |
Fig. 9 Differential flux of muon neutrinos from a flare in GRO J0422+32 arriving at the Earth. |
7. Detectability of GRO J0422+32 in neutrinos
In this section, we study whether the neutrino emission attributed to GRO J0422+42 by the corona model is detectable by the current high-energy neutrino experiments. Our detectability study takes the expected background of atmospheric neutrinos into account at the location of the source, as well as instrumental effects such as detection rate and angular resolution.
7.1. Instrumental effects
The small neutrino cross section and the atmospheric neutrino background level are the most important limitations in the discovery of extraterrestrial neutrino signals. For steady sources, the typical period for data analysis in neutrino telescopes is about one year. Here, the observations are background limited, and the sensitivity increases as a function of the exposure time, which is usually added on scales of years. This is not the case for transient sources, where the analyzed period should be on the same timescale as the duration of the burst. If the integration time is too long with respect to the source emitting span, the source disappears entirely in the background of atmospheric neutrinos. On the other hand, integration times that are too short would yield a non significant result because, in this case, the observation is limited by the detector efficiency. Many neutrinos do not interact near the detector, or the events do not pass event selection cuts up to the final neutrino sample. The detector’s point spread function (PSF) also has an impact on the detectable fluxes. The effect of the PSF will be to smear the signal from the source over some area, hence lessen the signal to noise ratio.
7.1.1. Detection rate
Our calculations for the detection rate make use of the
 effective area of the IceCube Neutrino Telescope in its 79-string configuration (Odrowski & IceCube coll. 2012). At the
declination of GRO J0422+32, the effective area is conveniently described with the
following expression:
effective area of the IceCube Neutrino Telescope in its 79-string configuration (Odrowski & IceCube coll. 2012). At the
declination of GRO J0422+32, the effective area is conveniently described with the
following expression:  (21)where
E is the neutrino energy in GeV. High-energy neutrino events have a
higher detection probability, due to both the proportionality between the neutrino cross
section with energy and the long path of the resulting muon, which can reach the
detector even if produced outside, thereby increasing the effective volume.
(21)where
E is the neutrino energy in GeV. High-energy neutrino events have a
higher detection probability, due to both the proportionality between the neutrino cross
section with energy and the long path of the resulting muon, which can reach the
detector even if produced outside, thereby increasing the effective volume.
Figure 10 shows the effective area superimposed on the neutrino spectra of GRO J0422+32 from the 1-h flare and from the 15-day plateau. Although IceCube reaches energies down to 10 GeV (Wiebusch & IceCube coll. 2009), we use a low-energy threshold of 100 GeV. Neutrino energies below this threshold are not suitable for neutrino astronomy because of the large neutrino-muon vertex angle. The expected event rates as a function of the energy, obtained after the multiplication of the two functions, are also represented in this figure. Above 300 GeV, the total neutrino event rate is 3.62 × 10⁻⁶ Hz, for the 1h flare, and 7.72 × 10⁻⁷ Hz during the 15-day plateau. As a consequence of the energy cutoff at ~8 TeV, neutrino efficiencies for temporal scales of hours, even days, are too low, and if the corona model is valid, the source would not be detected.
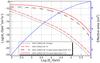 |
Fig. 10 Differential flux of neutrinos produced during the 15-day hard state and during the 1-h flare plotted against the effective area of the IceCube detector. The resulting energy distribution of event rates is also shown. |
In what follows, we examine the minimum flux required to discover a neutrino signal as a function of the integration time.
7.2. Atmospheric neutrino background and discovery flux
To claim a detection, the number of events observed from the location of GRO J0422+32 must overcome the background fluctuations at a 5σ level, meaning that the probability of observing this many events in a pure background-only case is below 2.8 × 10⁻⁷. Atmospheric neutrinos do not show significant seasonal variations (< 1%) (Ackermann & Bernardini 2005), so we use a Poisson model with a constant rate through the assumed period of data taken for the statistical description of the background. We use the statistics of event counts within a circular area around the source in order to set the 5σ level as a function of time. Then, the probability of finding k background events within the search area Ω is the Poisson probability of getting k events, given the mean rate of atmospheric neutrinos at the declination of GRO J0422+32.
Atmospheric neutrinos do not arrive at the detector isotropically, but with an energy and
zenith dependent component, because of both the direction of the cosmic ray shower through
the atmosphere, and, at E > 10 TeV, attenuation
of the neutrino flux by the Earth. The rate of atmospheric neutrino events within an area
Ω around the location of GRO J0422+32 is then estimated with 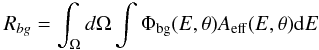 (22)where
Φbg(E,θ) is the atmospheric neutrino spectrum at declination
θ, and Aeff is the detector’s effective
area (Eq. (21)).
(22)where
Φbg(E,θ) is the atmospheric neutrino spectrum at declination
θ, and Aeff is the detector’s effective
area (Eq. (21)).
The atmospheric neutrino energy spectrum for
νμ ( ),
averaged over the declination range 7°−90°, has been measured by
the IceCube neutrino telescope in the energy range between 100 GeV to 400 TeV (Abbasi et al. 2011). GRO J0422+32 is located
at θ = 32°, where the energy distribution of atmospheric
neutrinos is represented well by the zenith-averaged spectrum.
),
averaged over the declination range 7°−90°, has been measured by
the IceCube neutrino telescope in the energy range between 100 GeV to 400 TeV (Abbasi et al. 2011). GRO J0422+32 is located
at θ = 32°, where the energy distribution of atmospheric
neutrinos is represented well by the zenith-averaged spectrum.
The area over which we perform the integration of Eq. (22) is the one that minimizes the required source strength for point-source emission, after assuming a PSF. In the case of IceCube in the 79-string configuration, the PSF for sources with a soft spectrum or an energy cutoff below 50 TeV has a median of ~1° (Odrowski & IceCube coll. 2012). We assume this PSF with a Gaussian profile. The optimal search area we find has a radius of 1.75°, corresponding to a ~80% signal retention. The rate of atmospheric neutrinos at the location of GRO J0422+32 within this area is Rbg = 1.06 × 10⁻⁶ Hz.
The discovery flux is calculated as the minimum flux required to produce, in 50% of synthetic data sets, a 5σ excess of events within the search area Ω around GRO J0422+32, during the integration time Δt. In each of the simulated data sets the number of background events within Ω is drawn from a Poisson distribution with mean equal to the product of Rbg × Δt, and signal events are injected in Ω following the assumed Gaussian PSF with ~1° median. Figure 11 shows the discovery flux as function of the integration time Δt on scales of days for two source spectra: the one from GRO J0422+32 in the corona model, following E-2 with an energy cutoff at 8 TeV, and an unbroken E-2 spectrum for comparison. The effect of the energy cutoff in the detectability of the source is evident in this figure. Both the strongest neutrino flare of 1 h duration and the source during the ~20 day hard-state remain undetected in the ~8 TeV cutoff emission scenario. However, if somehow the same or even a smaller amount of energy goes into the acceleration of less relativistic particles but reaching higher energies, close to PeV, the source could be detected.
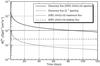 |
Fig. 11 Discovery Flux Φ0, where Φν = Φ0E-2.16exp(− (E/8 TeV)-0.52) for the case of GRO J0422+32 and an unbroken spectrum Φν = Φ0E-2 used for comparison. |
8. Discussion
Under the physical conditions adopted in our model, the main result obtained is that, if an outburst with similar characteristic to the one observed in 1992 takes place in the present, the probability of detecting it with IceCube is very low. This is due, mainly, to the very short duration of the high-energy flares observed in this source (less than a day).
There are, however, many factors that can enhance the neutrino emission in sources like GRO J0422+32. For example, if the acceleration efficiency increases, then relativistic protons will be able to achieve higher energies, where the neutrino cross-section increases. This will be possible with higher values of the magnetic field in the corona.
Another possibility may be a larger hadron content in the plasma, since neutrinos are produced in hadronic interactions. However, in our model we are already considering a = 100, which is the ratio observed in cosmic rays, so there is no physical reason for taking a > 100.
Since the main restriction in our study for detectability was the short period of time of activity, is it straightforward to consider longer outbursts. If the neutrino flux remains as in the peak of the event (Fig. 9, t = 1 h) along ~80 days (see Fig. 11), IceCube will in fact be capable of detecting the source. It will also be detectable if it remains longer in the plateau phase, ~690 days.
This is the most likely scenario. There are several systems like GRO J0422+32 that shows high-energy episodes with the characteristics needed to enhance the neutrino emission.
A clear example is GRO J1719-24, which is also a low-mass X-ray binary system that displayed similar gamma-ray spectral characteristics to those observed in Cygnus X-1 and GRO J0422+32 (Ling & Wheaton 2005). This source was detected in 1993, during an X-ray outburst that lasted ~1000 days with a plateau phase of ~80 days (Ballet et al. 1993). Though the flares observed were also short, they were numerous, so the contribution of all flares may be significant.
Other examples of this are the low-mass X-ray binaries XTE J1118+480 and GX 339-4. XTE J1118+480 is a transient XRB, which has shown two outburst since its discovery. The first outburst was in 2000 and lasted for about seven months, and the second was in 2005 and lasted for one to two months (Vila et al. 2012). GX 339-4 is a well studied system that was detected in the low-hard state on several occasions (1997, 1999 and 2002). The observed X-ray fluxes yield luminosities of up to L ~ 1037 erg s-1 (Vila & Romero 2010). The high luminosities detected during the outbursts of both sources and, additionally, the proximity of XTE J1118+480 (d = 1.72 kpc), make these systems good Galactic candidates as neutrino sources.
The main difference in these sources is that they present relativistic jets, whereas there is no evidence of a radio jet in GRO J0422+32. Neutrinos might also be produced in the jet if it has a hadron component. Until present, there is no clear evidence to indicate the composition of relativistic jets, although many studies support a hadronic content (Heinz 2008; Romero 2008). Future high-energy detectors, such as CTA, may shed light on this aspect of X-ray binaries.
9. Conclusions
We applied a magnetized corona model to describe the spectrum of the low-mass X-ray binary GRO J0422+32 during the outburst of 1992. The presence of nonthermal populations of electron and protons and their interactions with the different fields of the source can explain the high-energy emission detected during the hard state of the source. The model has two main free parameters: the fraction of power injected in relativistic particles (q) and the hadron-to-lepton energy ratio (a). The best fit to the spectra is obtained with a = 100 and q = 0.12.
Then, we studied the source during a nonthermal flare, produced by an increase in the power injected in relativistic particles. In particular, we considered q = 0.15, which is the maximum energy available for accelerating particles by magnetic reconnection in our model. The flare duration was taken to be shorter than a day, which was limited by the available spectra.
We also estimated the neutrino emission during a flare event, and during the plateau phase of the outburst. Given the short time of activity of the source, a more detailed analysis to study detectability with IceCube is needed.
Although we conclude that the detection of neutrino from an episode like the one studied here is very unlikely, longer events in other Galactic sources may be detectable in the future by IceCube.
Cygnus X-1 has a well-resolved jet that is responsible for the radio emission (Stirling et al. 2001). In this work, however, we are concerned with the emission at higher energies.
Acknowledgments
The authors are grateful to James Ling for providing the data of the BATSE instrument. F.L.V. thanks Orlando Peres for his insightful comments on neutrino oscillations and the Departament d’Astronomia i Meteorologia, Universitat de Barcelona, where part of this work was carried out. Yolanda Sestayo acknowledges the financial support from J. M. Paredes through ICREA Academia. This work was partially supported by the Argentine Agencies CONICET (PIP 0078) and ANPCyT (PICT 2007-00848), as well as by the Spanish Ministerio de Ciencia e Innovación (MICINN) under grant AYA2010-21782-C03-01.
References
- Abbasi, R., Abdou, Y., Abu-Zayyad, T., et al. 2011, Phys. Rev. D, 83, 012001 [Google Scholar]
- Abdo, A. A., Ackermann, M., Ajello, M., et al. 2009, Science, 326, 1512 [NASA ADS] [CrossRef] [PubMed] [Google Scholar]
- Ackermann, M., & Bernardini, E. 2005, in International Cosmic Ray Conference, 9, 107 [Google Scholar]
- Albert, J., Aliu, E., Anderhub, H., et al. 2007, ApJ, 665, L51 [NASA ADS] [CrossRef] [Google Scholar]
- Ballet, J., Denis, M., Gilfanov, M., et al. 1993, IAU Circ., 5874, 1 [NASA ADS] [Google Scholar]
- Beekman, G., Shahbaz, T., Naylor, T., et al. 1997, MNRAS, 290, 303 [NASA ADS] [CrossRef] [Google Scholar]
- Belmont, R., Malzac, J., & Marcowith, A. 2008, A&A, 491, 617 [NASA ADS] [CrossRef] [EDP Sciences] [Google Scholar]
- Beloborodov, A. M. 1999, in High Energy Processes in Accreting Black Holes, eds. J. Poutanen, & R. Svensson, ASP Conf. Ser., 161, 295 [Google Scholar]
- Brocksopp, C., Bandyopadhyay, R. M., & Fender, R. P. 2004, New A, 9, 249 [Google Scholar]
- Callanan, P. J., Garcia, M. R., McClintock, J. E., et al. 1996, ApJ, 461, 351 [NASA ADS] [CrossRef] [Google Scholar]
- Casares, J., Marsh, T. R., Charles, P. A., et al. 1995, MNRAS, 274, 565 [NASA ADS] [CrossRef] [Google Scholar]
- Castro-Tirado, A. J., Pavlenko, E. P., Shlyapnikov, A. A., et al. 1993, A&A, 276, L37 [NASA ADS] [Google Scholar]
- Christiansen, H. R., Orellana, M., & Romero, G. E. 2006, Phys. Rev. D, 73, 063012 [NASA ADS] [CrossRef] [Google Scholar]
- de Gouveia dal Pino, E. M., & Lazarian, A. 2005, A&A, 441, 845 [NASA ADS] [CrossRef] [EDP Sciences] [Google Scholar]
- del Valle, M. V., Romero, G. E., Luque-Escamilla, P. L., Martí, J., & RamónSánchez-Sutil, J. 2011, ApJ, 738, 115 [NASA ADS] [CrossRef] [Google Scholar]
- Drury, L. O. 2012, MNRAS, 422, 2474 [NASA ADS] [CrossRef] [Google Scholar]
- Esin, A. A., Narayan, R., Cui, W., Grove, J. E., & Zhang, S.-N. 1998, ApJ, 505, 854 [NASA ADS] [CrossRef] [Google Scholar]
- Esmaili, A. 2010, Phys. Rev. D, 81, 013006 [NASA ADS] [CrossRef] [Google Scholar]
- Filippenko, A. V., Matheson, T., & Ho, L. C. 1995, ApJ, 455, 614 [NASA ADS] [CrossRef] [Google Scholar]
- Garcia, M. R., Callanan, P. J., McClintock, J. E., & Zhao, P. 1996, ApJ, 460, 932 [NASA ADS] [CrossRef] [Google Scholar]
- Garcia, M. R., McClintock, J. E., Narayan, R., et al. 2001, ApJ, 553, L47 [NASA ADS] [CrossRef] [Google Scholar]
- Golenetskii, S., Aptekar, R., Frederiks, D., et al. 2003, ApJ, 596, 1113 [NASA ADS] [CrossRef] [Google Scholar]
- Grove, J. E., Johnson, W. N., Kroeger, R. A., et al. 1998, ApJ, 500, 899 [NASA ADS] [CrossRef] [Google Scholar]
- Harmon, B. A., Wilson, R. B., Fishman, G. J., et al. 1992, IAU Circ., 5584, 2 [NASA ADS] [Google Scholar]
- Heinz, S. 2008, Int. J. Mod. Phys. D, 17, 1947 [NASA ADS] [CrossRef] [Google Scholar]
- Hillas, A. M. 1984, ARA&A, 22, 425 [NASA ADS] [CrossRef] [Google Scholar]
- Hynes, R. I., & Robinson, E. L. 2012, ApJ, 749, 3 [NASA ADS] [CrossRef] [Google Scholar]
- Kappes, A., Hinton, J., Stegmann, C., & Aharonian, F. A. 2007, ApJ, 656, 870 [NASA ADS] [CrossRef] [Google Scholar]
- Kowal, G., de Gouveia Dal Pino, E. M., & Lazarian, A. 2011, ApJ, 735, 102 [NASA ADS] [CrossRef] [Google Scholar]
- Levinson, A., & Mattox, J. R. 1996, ApJ, 462, L67 [NASA ADS] [CrossRef] [Google Scholar]
- Li, H., & Miller, J. A. 1997, ApJ, 478, L67 [NASA ADS] [CrossRef] [Google Scholar]
- Li, H., Kusunose, M., & Liang, E. P. 1996, ApJ, 460, L29 [NASA ADS] [CrossRef] [Google Scholar]
- Lin, R. P. 2008, in American Institute of Physics Conference Series, eds. G. Li, Q. Hu, O. Verkhoglyadova, G. P. Zank, R. P. Lin, & J. Luhmann, AIP Conf. Ser., 1039, 52 [Google Scholar]
- Ling, J. C., & Wheaton, W. A. 2003, ApJ, 584, 399 [NASA ADS] [CrossRef] [Google Scholar]
- Ling, J. C., & Wheaton, W. A. 2005, ApJ, 622, 492 [NASA ADS] [CrossRef] [Google Scholar]
- Lipari, P., Lusignoli, M., & Meloni, D. 2007, Phys. Rev. D, 75, 123005 [NASA ADS] [CrossRef] [Google Scholar]
- Malzac, J., & Belmont, R. 2009, MNRAS, 392, 570 [NASA ADS] [CrossRef] [Google Scholar]
- Malzac, J., & Jourdain, E. 2000, A&A, 359, 843 [NASA ADS] [Google Scholar]
- Mazets, E. P., Aptekar, R. L., Frederiks, D. D., et al. 1996, in AIP Conf. Ser. 384, eds. C. Kouveliotou, M. F. Briggs, & G. J. Fishman, 492 [Google Scholar]
- McConnell, M. L., Ryan, J. M., Collmar, W., et al. 2000, ApJ, 543, 928 [NASA ADS] [CrossRef] [Google Scholar]
- Miller-Jones, J. C. A., Jonker, P. G., Maccarone, T. J., Nelemans, G., & Calvelo, D. E. 2011, ApJ, 739, L18 [NASA ADS] [CrossRef] [Google Scholar]
- Nakamura, K., & Particle Data Group 2010, J. Phys. G Nucl. Phys., 37, 075021 [NASA ADS] [CrossRef] [Google Scholar]
- Narayan, R., & Yi, I. 1994, ApJ, 428, L13 [NASA ADS] [CrossRef] [Google Scholar]
- Narayan, R., & Yi, I. 1995a, ApJ, 444, 231 [NASA ADS] [CrossRef] [Google Scholar]
- Narayan, R., & Yi, I. 1995b, ApJ, 452, 710 [NASA ADS] [CrossRef] [Google Scholar]
- Odrowski, S. 2011, Ph.D. Thesis, Universitat Heidelberg [Google Scholar]
- Odrowski, S., & IceCube coll. 2012, Neutrino 2012, Kyoto, Japan [Google Scholar]
- Orosz, J. A., & Bailyn, C. D. 1995, ApJ, 446, L59 [NASA ADS] [CrossRef] [Google Scholar]
- Paciesas, W. S., Briggs, M. S., Harmon, B. A., Wilson, R. B., & Finger, M. H. 1992, IAU Circ., 5580, 1 [NASA ADS] [Google Scholar]
- Poutanen, J. 1998, in Theory of Black Hole Accretion Disks, eds. M. A. Abramowicz, G. Bjornsson, & J. E. Pringle, Cambridge Contemporary Astrophysics (Cambridge, UK: Cambridge University Press), 100 [Google Scholar]
- Poutanen, J., & Svensson, R. 1996, ApJ, 470, 249 [NASA ADS] [CrossRef] [Google Scholar]
- Poutanen, J., Krolik, J. H., & Ryde, F. 1997, MNRAS, 292, L21 [NASA ADS] [Google Scholar]
- Reid, I. N., Hawley, S. L., & Gizis, J. E. 1995, AJ, 110, 1838 [NASA ADS] [CrossRef] [Google Scholar]
- Reynolds, M. T., Callanan, P. J., & Filippenko, A. V. 2007, MNRAS, 374, 657 [NASA ADS] [CrossRef] [Google Scholar]
- Reynoso, M. M., & Romero, G. E. 2009, A&A, 493, 1 [NASA ADS] [CrossRef] [EDP Sciences] [Google Scholar]
- Romero, G. E. 2008, PoS (MQW7), 20 [Google Scholar]
- Romero, G. E., & Vila, G. S. 2008, A&A, 485, 623 [NASA ADS] [CrossRef] [EDP Sciences] [Google Scholar]
- Romero, G. E., Reynoso, M. M., & Christiansen, H. R. 2010a, A&A, 524, A4 [NASA ADS] [CrossRef] [EDP Sciences] [Google Scholar]
- Romero, G. E., Vieyro, F. L., & Vila, G. S. 2010b, A&A, 519, A109 [NASA ADS] [CrossRef] [EDP Sciences] [Google Scholar]
- Shrader, C. R., Wagner, R. M., Hjellming, R. M., Han, X. H., & Starrfield, S. G. 1994, ApJ, 434, 698 [NASA ADS] [CrossRef] [Google Scholar]
- Stern, B. E., Beloborodov, A. M., & Poutanen, J. 2001, ApJ, 555, 829 [NASA ADS] [CrossRef] [Google Scholar]
- Stirling, A. M., Spencer, R. E., de la Force, C. J., et al. 2001, MNRAS, 327, 1273 [NASA ADS] [CrossRef] [Google Scholar]
- Sunyaev, R. A., Kaniovsky, A. S., Borozdin, K. N., et al. 1993, A&A, 280, L1 [NASA ADS] [Google Scholar]
- Tavani, M., Bulgarelli, A., Piano, G., et al. 2009, Nature, 462, 620 [NASA ADS] [CrossRef] [PubMed] [Google Scholar]
- Tsuneta, S., & Naito, T. 1998, ApJ, 495, L67 [NASA ADS] [CrossRef] [Google Scholar]
- Vieyro, F. L., & Romero, G. E. 2012, A&A, 542, A7 [NASA ADS] [CrossRef] [EDP Sciences] [Google Scholar]
- Vila, G. S., & Aharonian, F. A. 2009, in Compact Objects and their Emission, eds. G. E. Romero, & P. Benaglia, Asociación Argentina de Astronomía, Book Series (La Plata, Argentina: Editorial Paideia), 1 [Google Scholar]
- Vila, G. S., & Romero, G. E. 2010, MNRAS, 403, 1457 [NASA ADS] [CrossRef] [Google Scholar]
- Vila, G. S., Romero, G. E., & Casco, N. A. 2012, A&A, 538, A97 [NASA ADS] [CrossRef] [EDP Sciences] [Google Scholar]
- Vissani, F., & Aharonian, F. 2012, NIM A, accepted [arXiv:1112.3911V] [Google Scholar]
- Vurm, I., & Poutanen, J. 2009, ApJ, 698, 293 [NASA ADS] [CrossRef] [Google Scholar]
- Wiebusch, C., & IceCube coll. 2009, Proceedings of the 31st ICRC, Lodz, Poland [Google Scholar]
- Zhao, P., Callanan, P., Garcia, M., & McClintock, J. 1994, IAU Circ., 6072, 2 [NASA ADS] [Google Scholar]
All Tables
All Figures
|
Fig. 1 Schematic representation of the components of the system discussed in the text. In the spherical corona, the thermal and nonthermal components are co spatial. Not to scale. |
| In the text | |
|
Fig. 2 The spectrum of GRO J0422+32 observed with instruments onboard the Mir-Kvant observatory, fitted with a power law of index 1.49 and an exponential cut-off 132 keV (Sunyaev et al. 1993). |
| In the text | |
 |
Fig. 3 Energy losses in a corona characterized by the parameters of Table 1. |
| In the text | |
|
Fig. 4 Flux histories detected with BATSE in the energy bands 100–200 keV (left panel) and 200–300 keV (right panel). The data is from Ling & Wheaton (2003). The plateau phase is the period of ~15 days between TJD ~ 8 845 and TJD ~ 8 860. Lines (b) and (c) correspond to TJD 8 848 and 8 855, respectively, where the two first maxima at E < 200 keV were detected; in an analogous way, lines (a) and (d) correspond to TJD 8 843 and 8 862, where the two first maxima at E > 200 keV were detected. |
| In the text | |
|
Fig. 5 Spectrum of GRO J0422+32 detected with BATSE (Ling & Wheaton 2003) and fitted with the spectral energy distribution obtained with a nonthermal corona model. The values of the free parameters in this adjustment are a = 100 and q = 0.12. |
| In the text | |
|
Fig. 6 Main contribution to the nonthermal luminosity. Internal absorption of the radiation is not included, but it has a strong impact on the final SED as shown in the previous figure. |
| In the text | |
|
Fig. 7 Evolution of the luminosity during a flare of ~2 h of duration. Since the cooling time scales in the corona are significantly shorter than flare time scales, the shape of the spectrum does not change and just shows decreasing luminosity levels as the flare evolves. |
| In the text | |
|
Fig. 8 Differential flux of muon neutrinos produced in the hard state of GRO J0422+32 arriving at the Earth. The effects of neutrino oscillations are included. |
| In the text | |
|
Fig. 9 Differential flux of muon neutrinos from a flare in GRO J0422+32 arriving at the Earth. |
| In the text | |
|
Fig. 10 Differential flux of neutrinos produced during the 15-day hard state and during the 1-h flare plotted against the effective area of the IceCube detector. The resulting energy distribution of event rates is also shown. |
| In the text | |
|
Fig. 11 Discovery Flux Φ0, where Φν = Φ0E-2.16exp(− (E/8 TeV)-0.52) for the case of GRO J0422+32 and an unbroken spectrum Φν = Φ0E-2 used for comparison. |
| In the text | |
Current usage metrics show cumulative count of Article Views (full-text article views including HTML views, PDF and ePub downloads, according to the available data) and Abstracts Views on Vision4Press platform.
Data correspond to usage on the plateform after 2015. The current usage metrics is available 48-96 hours after online publication and is updated daily on week days.
Initial download of the metrics may take a while.