Fig. 4
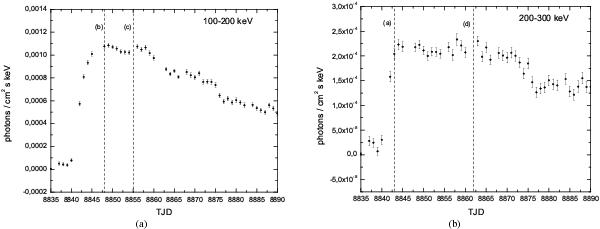
Flux histories detected with BATSE in the energy bands 100–200 keV (left panel) and 200–300 keV (right panel). The data is from Ling & Wheaton (2003). The plateau phase is the period of ~15 days between TJD ~ 8 845 and TJD ~ 8 860. Lines (b) and (c) correspond to TJD 8 848 and 8 855, respectively, where the two first maxima at E < 200 keV were detected; in an analogous way, lines (a) and (d) correspond to TJD 8 843 and 8 862, where the two first maxima at E > 200 keV were detected.
Current usage metrics show cumulative count of Article Views (full-text article views including HTML views, PDF and ePub downloads, according to the available data) and Abstracts Views on Vision4Press platform.
Data correspond to usage on the plateform after 2015. The current usage metrics is available 48-96 hours after online publication and is updated daily on week days.
Initial download of the metrics may take a while.