| Issue |
A&A
Volume 546, October 2012
|
|
|---|---|---|
| Article Number | A30 | |
| Number of page(s) | 5 | |
| Section | Stellar atmospheres | |
| DOI | https://doi.org/10.1051/0004-6361/201219907 | |
| Published online | 28 September 2012 | |
The magnetar candidate AX J1818.8−1559
1
INAF – Istituto di Astrofisica Spaziale e Fisica Cosmica Milano, via E.
Bassini 15,
20133
Milano,
Italy
e-mail: This email address is being protected from spambots. You need JavaScript enabled to view it.
2
IUSS – Istituto Universitario di Studi Superiori,
viale Lungo Ticino Sforza 56,
27100
Pavia,
Italy
3
AIM – CEA/Irfu/Service d’Astrophysique,
Orme des Merisiers,
91191
Gif-sur-Yvette,
France
4
INAF – Osservatorio Astronomico di Roma, via Frascati
33, 00040
Monteporzio Catone,
Italy
Received: 27 June 2012
Accepted: 31 July 2012
Abstract
In October 2007, a hard X-ray burst was detected by the INTEGRAL satellite from a direction consistent with the position of AX J1818.8−1559, an X-ray source at low Galactic latitude discovered with the Advanced Satellite for Cosmology and Astrophysics (ASCA) satellite in 1996–1999. The short duration (0.8 s) and soft spectrum (power-law photon index of 3.0 ± 0.2) of the burst in the 20–100 keV range are typical of soft gamma-ray repeaters and anomalous X-ray pulsars. We report on the results of an observation of AX J1818.8−1559 obtained with the Suzaku satellite in October 2011. The source spectrum, a power-law with photon index ~1.5, and flux (~2 × 10-12 erg cm-2 s-1, 2–10 keV) did not show significant variations from those derived from archival data of various satellites obtained from 1993 to 2011. We discuss possible interpretations of the data for AX J1818.8−1559 and, based on its association with the INTEGRAL burst, we propose it as a new member of the small class of magnetar candidates.
Key words: X-rays: bursts / stars: neutron / stars: magnetars / X-rays: individuals: AX J1818.8-1559
© ESO, 2012
1. Introduction
Although suggested more than four decades ago (e.g. Pacini 1967), the relevance of magnetic energy in powering the emission from neutron stars was recognized only recently, with the discoveries of anomalous X-ray pulsars (AXPs) and soft gamma-ray repeaters (SGRs). These are spinning-down, isolated neutron stars with luminosities in the soft and hard X-rays typically higher than their rotational energy loss and characterized by the emission of powerful bursts and flares. Historically, AXPs and SGRs were divided into two distinct classes, but many observations indicate that there are no substantial differences between them (see Mereghetti 2008, for a review). Even though alternative interpretations have been proposed (Chatterjee et al. 2000; Alpar 2001; Cea 2006; Xu 2007; Horvath 2007; Ouyed et al. 2007; Ertan et al. 2009), the model involving magnetars, i.e. highly magnetized neutron stars, is the one that currently most successfully explains the properties of AXPs and SGRs (Duncan & Thompson 1992; Thompson & Duncan 1995; Thompson et al. 2002). According to the magnetar model, the emission from these sources is ultimately powered by the energy stored in their strong magnetic fields, which is B ~ 1013–1014 G in the magnetosphere, and possibly reaches even higher values in the neutron star interior.
The originally small sample of AXPs/SGRs has increased significantly in recent years, mainly thanks to the discovery of transient sources, which had remained undetected (or unnoticed) until they underwent bright outbursts, often accompanied by the emission of short bursts (Rea & Esposito 2011). In a few other cases, new magnetar candidates were found by a thorough investigation of persistent X-ray sources with either peculiar properties or possible associations with supernova remnants (e.g. Gelfand & Gaensler 2007; Halpern & Gotthelf 2010b,a) or both, or the discovery of a peculiar radio pulsar (Levin et al. 2010; Anderson et al. 2012).
Many of the new additions to the magnetar family have shown that these objects have a variety of properties that were unsuspected for the original members of the class that connect them with other classes of isolated neutron stars. The radio detections of XTE J1810–197 and 1E 1547–54 (Camilo et al. 2006, 2007) and the very low spin-down rate of SGR 0418+5729 (Rea et al. 2010), implying a dipole field close to that of normal pulsars, are only a few examples.
The X-ray source AX J1818.8−1559 was discovered during a survey of the Galactic plane carried out with ASCA in 1996–1999 (Sugizaki et al. 2001), but did not attract particular attention until INTEGRAL detected a short burst from its direction in October 2007. Here we report on a detailed re-analysis of the INTEGRAL burst and the results of a long X-ray observation of AX J1818.8−1559 carried out with the Suzaku satellite in October 2011. We also present archival X-ray data obtained with the Roentgen Satellite (ROSAT), X-ray multi-mirror mission XMM-Newton, Chandra, and Swift to provide an exhaustive description of the X-ray properties of AX J1818.8−1559 and discuss its possible inclusion in the class of magnetar candidates.
2. The burst of 2007 October 17
A short burst at low Galactic latitude (b = −0.26), was discovered and localized in real time with the INTEGRAL Burst Alert System (IBAS; Mereghetti et al. 2003) on 2007 October 17. The burst reported as GRB 071017 (Mereghetti et al. 2007) was found in the data of the ISGRI detector (Lebrun et al. 2003), which is the low-energy imager of the IBIS coded-mask instrument on board INTEGRAL (Ubertini et al. 2003). The burst light-curves in different energy ranges (Fig. 1) show that, unlike the typical gamma-ray bursts (GRBs) observed by IBIS (Vianello et al. 2009), this event was not detected above 100 keV. The 15–40 keV light curve is characterized by a single pulse lasting ~0.8 s, with a short rise time starting at 00:58:08.55 UT followed by a slower decay in flux.
We performed a spectral analysis by extracting the ISGRI data of the first 0.2 s, corresponding to the brightest part of the burst. These results confirm that, as suggested by the light curves in different energy bands, the burst was rather soft. Its spectrum is equally well fit by a power law with photon index 3.0 ± 0.2 as a thermal bremsstrahlung with temperature kT = 25 ± 3 keV (Fig. 2). In both cases, the average flux in the 20–100 keV energy range is ~2 × 10⁻⁷ erg cm-2 s-1.
The burst localization that was obtained in real time by the automatic IBAS software had an error of 2.9′ and was consistent with the position of AX J1818.8−1559. We reanalyzed the ISGRI data using the most recent versions of the satellite attitude information and imaging software. Using the data in the 15–50 keV, where the signal to noise reached its maximum value, we obtained a 11.5σ detection of the burst at the coordinates RA = 274.731, Dec =−15.993 (J2000), with an uncertainty of 1.8′ (90% confidence level radius). The corresponding Galactic coordinates are l = 15.04, b = −0.26. The INTEGRAL error region is indicated by the circle in Fig. 3.
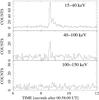 |
Fig. 1 Light curves of the 2007 October 17 burst measured with ISGRI in three energy ranges. The bin size is 50 ms. |
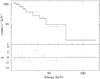 |
Fig. 2 ISGRI spectrum of the 2007 October 17 burst. Top panel: data and best-fit power-law model. Bottom panel: residuals in units of standard deviations. |
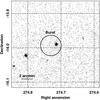 |
Fig. 3 Image of the region of AX J1818.8−1559 in the 2–10 keV energy range obtained with the XMM-Newton EPIC instrument. The circle (radius 1.8′) indicates the error region of the INTEGRAL burst. |
3. XMM-Newton archival data
The region of sky in the direction of GRB 071017 was observed for about 10 ks on 2003 March 28, during a survey of the Galactic plane carried out with the XMM-Newton satellite. Using the Science Analysis Software (SAS V11), we reprocessed the data of the EPIC instrument (0.2–12 keV), which consists of one pn (Turner et al. 2001) and two MOS (Strüder et al. 2001) cameras. A few X-ray sources are detected in the EPIC images, but only one, at an off-axis angle of 4′, lies in the error circle of the INTEGRAL burst (Fig. 3). Its coordinates are  , Dec = −15°59′23′′ (J2000), with an uncertainty of 2′′. On the basis of the positional coincidence, as well as the consistent spectral properties (see next paragraph), we identified the XMM-Newton source with AX J1818.8−1559 (Sugizaki et al. 2001).
No other sources were detected in the XMM-Newton data inside the error circle of the burst, down to a flux limit of a few 10-14 erg cm-2 s-1. A few other sources are visible in the EPIC image. A faint source is located 1′ from the southern border of the error circle, at  , Dec = −16°02′08′′ (J2000). Its flux is about a factor of 20 lower than that of AX J1818.8−1559. A brighter source, at
  , Dec = −16°01′20′′ (J2000), can be identified with the ASCA source AX J181915–1527 (Sugizaki et al. 2001).
Log of the observations.
To study the spectrum of AX J1818.8−1559, we extracted the pn and MOS source counts from a circle of 40′′ radius and the background spectra from source-free regions of the same CCD as the source. After rebinning to have at least 30 counts in each spectral bin, we fitted simultaneously the pn and two MOS spectra. A good fit was obtained with a power law of photon index Γ = 1.2 ± 0.2, absorption NH = (3.6 ± 0.5) × 1022 cm-2, and absorbed1 flux 1.4 × 10-12 erg cm-2 s-1 in the 2–10 keV energy range. These results are consistent with those we obtained in a quick-look analysis of the same data performed soon after the INTEGRAL GRB detection (Tiengo et al. 2007). The source distance is unknown, but considering its location in the direction of the Galactic center region and the large absorption, we assume in the following a reference value of 10 kpc. The 0.5–10 keV luminosity, corrected for the absorption, is ~2.4 × 1034 erg s-1. An equally good fit is obtained with a blackbody of temperature kTBB = 1.9 ± 0.1 keV and emission radius RBB = 0.12 ± 0.05 km. In this case, the absorption is NH = (1.6 ± 0.3) × 1022 cm-2. For comparison, the total Galactic absorption in this direction is 1.2 × 1022 cm-2 (Kalberla et al. 2005). All the spectral results are summarized in Table 2. The values obtained with the power-law model are very similar to those measured with ASCA in 1996–1999 (Sugizaki et al. 2001).
We searched for pulsations in the EPIC data with fast Fourier transform (FFT) and Rayleigh test methods without finding any statistically significant signal. However, this result is not particularly constraining owing to the relatively small number of counts. The 3σ upper limits to the pulsed fraction, A, in the 1–10 keV energy band are 50% for periods in the 0.3–1000 s range and ~50–70% between 145 and 300 ms2.
4. Suzaku observation
We performed a Suzaku observation of AX J1818.8−1559 from 2011 October 15 at 13:17 UT to October 18 at 03:32 UT. This provided data of about 80 ks of exposure time from the X-ray imager spectrometer (XIS) instrument. The XIS consists of four telescopes with a spatial resolution of about 2′ coupled to four CCD cameras operating in the 0.2–12 keV energy range (Koyama et al. 2007). At the time of our observation, only the two front-illuminated XIS0 and XIS3 and the back-illuminated XIS1 were operating. The three detectors were used in 1/8 window mode, which gives a time resolution of 1 s at the expense of a smaller field of view.
For the spectral analysis, we screened the data using standard criteria. In particular, we consider only events with GRADE = 0, 2–4, 6 and excluded time intervals within ΔT = 436 s of the south Atlantic anomaly (SAA) and pointed at elevation angles smaller than either 5° or 20° above the night or day Earth rim, respectively. Source and background spectra were extracted from circles of 1.1′ radius and rebinned so as to have a minimum of 20 counts per spectral bin. Slightly less stringent criteria were used for the timing analysis (ΔT = 60 s, 10° day Earth minimum elevation) to increase the exposure time, while keeping a reasonably low background.
We obtained a single spectrum by merging the XIS 0 and 3 (the two front-illuminated CCDs) data and fitted it simultaneously with the XIS1 spectrum. All the fits were done in the 1–10 keV range. Both a power law and a blackbody model gave acceptable results, with the best-fit parameters reported in Table 2. These values are similar to those derived in the XMM-Newton observation.
We searched for periodicities in the 2–1000 s range using an FFT analysis on the merged event lists from the three instruments. No periodicities were found, even trying different energy selections. The 3σ upper limit to the 1–10 keV pulsed fraction is ~30–40% between 2 s and 40 s, and ~25–30% above 40 s.
Spectral results.
5. Other archival data
5.1. Swift
A short observation (2 ks) with the Swift X-ray telescope (XRT) was performed on 2007 October 19, about two days after the INTEGRAL detection of the burst (Evans et al. 2007). A source with a count rate 0.012 ± 0.002 counts s-1 was detected at the coordinates  ,
,  (J2000;
  error radius, 90% confidence) consistent with the position of AX J1818.8−1559. The small number of counts was insufficient to perform a spectral analysis. Assuming the parameters of the XMM-Newton power-law fit, we derived a 2–10 keV observed flux of ~1.5 × 10⁻¹² erg cm-2 s-1.
This region of sky was observed again with the Swift/XRT on 2012 March 04, but no source was detected within or close to the error region of the burst. The short exposure time (0.5 ks) and off-axis position resulted in a rather shallow upper limit to the count rate of 0.027 counts s-1 (3σ c.l.), which is a factor ~2 above the flux level measured in October 2007.
5.2. Chandra
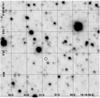 |
Fig. 4 Near-infrared (K-band) image of the region of AX J1818.8−1559 from the UKIDSS. The circle with radius 0.6 arcsec indicates the source position derived with Chandra. |
The Chandra observations of the field of AX J1818.8−1559 are listed in Table 13. The 2007 observations were done with the AXAF CCD imaging spectrometer (ACIS-S) instrument as a target of opportunity five days after the INTEGRAL burst detection. They consist of 5 ks of imaging data, with a time resolution of 3.2 s and a longer exposure in continuous clocking (CC) mode, which provides a higher time resolution (2.85 ms), but imaging only along a single direction. AX J1818.8−1559 is detected with a significance above 10σ in the imaging data, at coordinates  (
( ),
),  (
( ) (J2000); the quoted 1σ uncertainties are statistical only, and much smaller than the Chandra absolute astrometric accuracy,
  (radial, 90% c.l.). We show in Fig. 4 the Chandra error circle overlaid on the near infrared (K-band) image from the Galactic Plane Survey, collected as a part of the United Kingdom Infrared Deep Sky Survey (UKIDSS, Lucas et al. 2008). No counterparts are visible down to the limit of K ~ 17–18.
We extracted the spectra from the 2007 observations as follows. For the CC data, the source photons were accumulated within a 5 × 5 pixel region centered on AX J1818.8−1559 (one ACIS-S pixel corresponds to 0.492 arcsec); the background events were extracted from two symmetric (with respect to the source) regions along the image strip. For the imaging data, the source counts were selected in a ~5-pixel radius circular region and the background in an annulus with inner and outer radius of 20 and 30 pixels, respectively. After checking that they gave consistent results, the two spectra were fitted together yielding the best-fit parameters reported in Table 2.
AX J1818.8−1559 was also observed two times in 2008. In the first data set (2008 February), the source was detected at a significance level of 5σ, but the low quality statistics do not allow us to carry out a detailed analysis. We only note that the 0.3–7 keV count rate, 0.026 ± 0.004 counts s-1, is in line with that observed in the 2007 ACIS-S imaging observation, 0.024 ± 0.002 counts s-1. In the second data set (2008 September), a short HRC-I exposure, the source was not detected. The 3σ upper limit to the count rate was 0.026 counts s-1, which, adopting the Chandra power-law model of Table 2, translates into an upper limit to the observed 2–10 keV flux of ~5 × 10-12 erg cm-2 s-1.
The most sensitive data for timing analysis were provided by the 2007 data in CC mode, which yielded ~1400 source photons. By means of an FFT analysis of these data, we were able to set a 3σ upper limit of ~40% to the 1–10 keV pulsed fraction for periods in the range 0.01–1000 s, and ~40–60% for periods in the range 5–10 ms.
5.3. ROSAT
The position of AX J1818.8−1559 was serendipitously covered by a ROSAT observation on 11–12 September 1993, falling at an off-axis angle of ~35′ in the PSPC instrument. From these data providing an exposure of ~7 ks, we derived a 3σ upper limit of ~0.01 counts s-1 to the source count rate in the 0.1–2.4 keV energy range. Assuming the same spectral shape of the XMM-Newton observation, this corresponds to an unabsorbed flux on the order of 2 × 10-11 erg cm-2 s-1 in the 0.5–10 keV range.
6. Discussion
A subclass of GRBs, the so-called X-ray flashes (Heise et al. 2001), can have spectra as soft as observed in GRB 071017. However, for the class of short GRBs with durations shorter than 2 s, such soft spectra are never observed. On the other hand, the hard X-ray (E > 20 keV) spectra of short bursts from SGRs are usually well-described by thermal bremsstrahlung models of temperature ~20–40 keV (Aptekar et al. 2001; Götz et al. 2004), as observed in GRB 071017. Assuming a distance of 10 kpc, the peak luminosity of the INTEGRAL burst is on the order of ~5 × 1039 erg s-1, which is a reasonable value for a Galactic SGR. Thus, although we cannot completely exclude that GRB 071017 was a GRB seen through the Galaxy, we believe that, in view of its location in the Galactic plane and spectral properties, an explanation in terms of a Galactic AXP/SGR is much more likely.
The chance probability of finding an X-ray source of a given brightness inside the 10 arcmin2 INTEGRAL error circle can be estimated using the LogN-LogS relations derived by Sugizaki et al. (2001) from the survey of the Galactic plane in which AX J1818.8−1559 was discovered. Including the small contribution from extragalactic sources seen through the Galactic plane, these relations give a surface density of 1.2 deg-2, for sources with fluxes equal to or greater than that of AX J1818.8−1559. This leads to a probability of ~3 × 10⁻³ of finding AX J1818.8−1559 in the INTEGRAL error region by chance, which indicates its very likely association with the burst.
The X-ray spectrum of AX J1818.8−1559 is harder than that of typical SGRs and AXPs, which, when fitted with a single power-law, give photon indexes in the range ~2–4 (Mereghetti et al. 2002; Kaspi & Boydstun 2010). Harder spectra have been observed in transient magnetars during the initial phases of their outbursts, but our analysis of X-ray observations of AX J1818.8−1559 obtained from 2003 to 2012, as well as earlier ASCA observations (Sugizaki et al. 2001), do not show evidence of any transient behavior. All the measured fluxes and upper limits indeed indicate a steady luminosity of 2 × 1034 (d/[10 kpc])2 erg s-1, which is consistent with that observed in persistent magnetars. The lack of detection of pulsations is not a particularly tight constraint, considering that many of the AXPs and SGRs have pulsed fractions smaller than the upper limits we could set on AX J1818.8−1559 (Mereghetti et al. 2002).
Only a single burst has been observed in the direction of AX J1818.8−1559, despite this region of sky in the Galactic bulge having been repeatedly observed by high-energy satellites. This contrasts with the abundance of bursts, which are often grouped into time intervals of spasmodic activity, observed in the most active members of the SGR family (e.g., SGR 1806–20, Göğüş et al. 2000; SGR 1900 + 14, Israel et al. 2008; SGR 1627–41, Esposito et al. 2008; or 1E 1547.0–5408, Mereghetti et al. 2009). The behavior of AX J1818.8−1559 is instead similar to that of a few magnetars from which bursts were detected only sporadically, such as for example 1E 1048.1–5937 (Gavriil et al. 2002), SGR 0418 + 5729 (van der Horst et al. 2010), SGR 1833–0832 (Göğüş et al. 2010), or 4U 0142 + 61 (Gavriil et al. 2011).
We finally note that the available observations do not favor alternative explanations of the observed properties of AX J1818.8−1559. Coronal emission from a star can be ruled out by the lack of a bright optical counterpart, the hard spectrum, and the large absorption, which is inconsistent with the small distance that would be required in this hypothesis. The X-ray to optical flux ratio excludes the possibility of a high-mass X-ray binary. Either a low-mass X-ray binary or an active galactic nucleus cannot be excluded, but neither are supported by the hard spectrum and lack of long-term variability, respectively.
7. Conclusion
A new observation of AX J1818.8−1559 obtained with the Suzaku satellite as well as a comprehensive analysis of archival data from different missions have been unable to establish the
real nature of this source, which is most likely associated with a SGR-like burst observed with INTEGRAL in October 2007. The X-ray properties of AX J1818.8−1559 are consistent with those observed in AXPs and SGRs, and we propose it as a likely new member of this class of sources deserving further study.
We use the PHABS absorption model in XSPEC with abundances from Anders & Grevesse (1989).
Here and in the following, we assume a sinusoidal modulation of the flux F(t) = Fo [1 + Asin(Ωt)] and define the pulsed fraction as the sinusoid amplitude A. All the upper limits to A are computed as described in Israel & Stella (1996).
Another observation was performed in August 2009 (obs. ID 10503), but the position of AX J1818.8−1559 then fell in the gap between the ACIS-S CCDs.
Acknowledgments
This work was partially supported with contributions from the agreements ASI-INAF I/009/10/0 and I/032/10/0. This research has made use of data obtained from the Suzaku satellite, a collaborative mission between the space agencies of Japan (JAXA) and the USA (NASA). We also made use of data and software provided by the NASA/GFSC’s HEASARC, the Chandra X-ray Centre and the ESA’s XMM-Newton Science Archive. We thank the referee, V. Kaspi, for her useful comments.
References
- Alpar, M. A. 2001, ApJ, 554, 1245 [NASA ADS] [CrossRef] [Google Scholar]
- Anders, E., & Grevesse, N. 1989, Geochim. Cosmochim. Acta, 53, 197 [Google Scholar]
- Anderson, G. E., Gaensler, B. M., Slane, P. O., et al. 2012, ApJ, 751, 53 [NASA ADS] [CrossRef] [Google Scholar]
- Aptekar, R. L., Frederiks, D. D., Golenetskii, S. V., et al. 2001, ApJS, 137, 227 [NASA ADS] [CrossRef] [Google Scholar]
- Camilo, F., Ransom, S. M., Halpern, J. P., et al. 2006, Nature, 442, 892 [NASA ADS] [CrossRef] [PubMed] [Google Scholar]
- Camilo, F., Ransom, S. M., Halpern, J. P., & Reynolds, J. 2007, ApJ, 666, L93 [NASA ADS] [CrossRef] [Google Scholar]
- Cea, P. 2006, A&A, 450, 199 [NASA ADS] [CrossRef] [EDP Sciences] [Google Scholar]
- Chatterjee, P., Hernquist, L., & Narayan, R. 2000, ApJ, 534, 373 [NASA ADS] [CrossRef] [Google Scholar]
- Duncan, R. C., & Thompson, C. 1992, ApJ, 392, L9 [NASA ADS] [CrossRef] [Google Scholar]
- Ertan, Ü., Ekşi, K. Y., Erkut, M. H., & Alpar, M. A. 2009, ApJ, 702, 1309 [NASA ADS] [CrossRef] [Google Scholar]
- Esposito, P., Israel, G. L., Zane, S., et al. 2008, MNRAS, 390, L34 [NASA ADS] [Google Scholar]
- Evans, P. A., Starling, R. L. C., O’Brien, P. T., et al. 2007, GRB Coordinates Network, 6942, 1 [NASA ADS] [Google Scholar]
- Gavriil, F. P., Kaspi, V. M., & Woods, P. M. 2002, Nature, 419, 142 [NASA ADS] [CrossRef] [PubMed] [Google Scholar]
- Gavriil, F. P., Dib, R., & Kaspi, V. M. 2011, ApJ, 736, 138 [NASA ADS] [CrossRef] [Google Scholar]
- Gelfand, J. D. & Gaensler, B. M. 2007, ApJ, 667, 1111 [NASA ADS] [CrossRef] [Google Scholar]
- Götz, D., Mereghetti, S., Mirabel, I. F., & Hurley, K. 2004, A&A, 417, L45 [NASA ADS] [CrossRef] [EDP Sciences] [Google Scholar]
- Göğüş, E., Woods, P. M., Kouveliotou, C., et al. 2000, ApJ, 532, L121 [NASA ADS] [CrossRef] [Google Scholar]
- Göğüş, E., Cusumano, G., Levan, A. J., et al. 2010, ApJ, 718, 331 [NASA ADS] [CrossRef] [Google Scholar]
- Halpern, J. P., & Gotthelf, E. V. 2010a, ApJ, 725, 1384 [NASA ADS] [CrossRef] [Google Scholar]
- Halpern, J. P., & Gotthelf, E. V. 2010b, ApJ, 710, 941 [NASA ADS] [CrossRef] [Google Scholar]
- Heise, J., Zand, J. I., Kippen, R. M., & Woods, P. M. 2001, in Gamma-ray Bursts in the Afterglow Era, eds. E. Costa, F. Frontera, & J. Hjorth, 16 [Google Scholar]
- Horvath, J. E. 2007, Ap&SS, 308, 431 [NASA ADS] [CrossRef] [Google Scholar]
- Israel, G. L., & Stella, L. 1996, ApJ, 468, 369 [NASA ADS] [CrossRef] [Google Scholar]
- Israel, G. L., Romano, P., Mangano, V., et al. 2008, ApJ, 685, 1114 [NASA ADS] [CrossRef] [Google Scholar]
- Kalberla, P. M. W., Burton, W. B., Hartmann, D., et al. 2005, A&A, 440, 775 [NASA ADS] [CrossRef] [EDP Sciences] [Google Scholar]
- Kaspi, V. M., & Boydstun, K. 2010, ApJ, 710, L115 [NASA ADS] [CrossRef] [Google Scholar]
- Koyama, K., Tsunemi, H., Dotani, T., et al. 2007, PASJ, 59, 23 [Google Scholar]
- Lebrun, F., Leray, J. P., Lavocat, P., et al. 2003, A&A, 411, L141 [NASA ADS] [CrossRef] [EDP Sciences] [Google Scholar]
- Levin, L., Bailes, M., Bates, S., et al. 2010, ApJ, 721, L33 [NASA ADS] [CrossRef] [Google Scholar]
- Lucas, P. W., Hoare, M. G., Longmore, A., et al. 2008, MNRAS, 391, 136 [NASA ADS] [CrossRef] [Google Scholar]
- Mereghetti, S. 2008, A&ARv, 15, 225 [NASA ADS] [CrossRef] [Google Scholar]
- Mereghetti, S., Chiarlone, L., Israel, G. L., & Stella, L. 2002, in Neutron Stars, Pulsars, and Supernova Remnants, eds. W. Becker, H. Lesch, & J. Trümper, 29 [Google Scholar]
- Mereghetti, S., Götz, D., Borkowski, J., Walter, R., & Pedersen, H. 2003, A&A, 411, L291 [NASA ADS] [CrossRef] [EDP Sciences] [Google Scholar]
- Mereghetti, S., Paizis, A., Gotz, D., et al. 2007, GRB Coordinates Network, 6927, 1 [NASA ADS] [Google Scholar]
- Mereghetti, S., Götz, D., Weidenspointner, G., et al. 2009, ApJ, 696, L74 [NASA ADS] [CrossRef] [Google Scholar]
- Ouyed, R., Leahy, D., & Niebergal, B. 2007, A&A, 473, 357 [NASA ADS] [CrossRef] [EDP Sciences] [Google Scholar]
- Pacini, F. 1967, Nature, 216, 567 [NASA ADS] [CrossRef] [Google Scholar]
- Rea, N., & Esposito, P. 2011, in High-Energy Emission from Pulsars and their Systems, eds. D. F. Torres, & N. Rea, 247 [Google Scholar]
- Rea, N., Esposito, P., Turolla, R., et al. 2010, Science, 330, 944 [NASA ADS] [CrossRef] [PubMed] [Google Scholar]
- Strüder, L., Briel, U., Dennerl, K., et al. 2001, A&A, 365, L18 [NASA ADS] [CrossRef] [EDP Sciences] [Google Scholar]
- Sugizaki, M., Mitsuda, K., Kaneda, H., et al. 2001, ApJS, 134, 77 [NASA ADS] [CrossRef] [Google Scholar]
- Thompson, C., & Duncan, R. C. 1995, MNRAS, 275, 255 [NASA ADS] [CrossRef] [Google Scholar]
- Thompson, C., Lyutikov, M., & Kulkarni, S. R. 2002, ApJ, 574, 332 [NASA ADS] [CrossRef] [Google Scholar]
- Tiengo, A., Mereghetti, S., Esposito, P., De Luca, A., & Gotz, D. 2007, The Astronomer’s Telegram, 1243, 1 [NASA ADS] [Google Scholar]
- Turner, M. J. L., Abbey, A., Arnaud, M., et al. 2001, A&A, 365, L27 [NASA ADS] [CrossRef] [EDP Sciences] [Google Scholar]
- Ubertini, P., Lebrun, F., Di Cocco, G., et al. 2003, A&A, 411, L131 [NASA ADS] [CrossRef] [EDP Sciences] [Google Scholar]
- van der Horst, A. J., Connaughton, V., Kouveliotou, C., et al. 2010, ApJ, 711, L1 [NASA ADS] [CrossRef] [Google Scholar]
- Vianello, G., Götz, D., & Mereghetti, S. 2009, A&A, 495, 1005 [NASA ADS] [CrossRef] [EDP Sciences] [Google Scholar]
- Xu, R. 2007, Adv. Space Res., 40, 1453 [NASA ADS] [CrossRef] [Google Scholar]
All Tables
All Figures
|
Fig. 1 Light curves of the 2007 October 17 burst measured with ISGRI in three energy ranges. The bin size is 50 ms. |
| In the text | |
|
Fig. 2 ISGRI spectrum of the 2007 October 17 burst. Top panel: data and best-fit power-law model. Bottom panel: residuals in units of standard deviations. |
| In the text | |
|
Fig. 3 Image of the region of AX J1818.8−1559 in the 2–10 keV energy range obtained with the XMM-Newton EPIC instrument. The circle (radius 1.8′) indicates the error region of the INTEGRAL burst. |
| In the text | |
|
Fig. 4 Near-infrared (K-band) image of the region of AX J1818.8−1559 from the UKIDSS. The circle with radius 0.6 arcsec indicates the source position derived with Chandra. |
| In the text | |
Current usage metrics show cumulative count of Article Views (full-text article views including HTML views, PDF and ePub downloads, according to the available data) and Abstracts Views on Vision4Press platform.
Data correspond to usage on the plateform after 2015. The current usage metrics is available 48-96 hours after online publication and is updated daily on week days.
Initial download of the metrics may take a while.