Free Access
Fig. 2
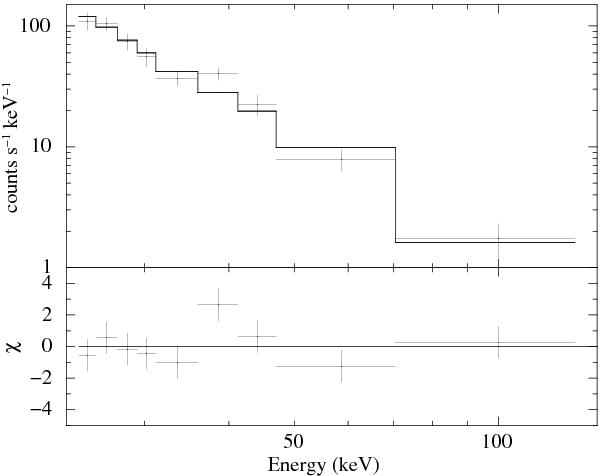
ISGRI spectrum of the 2007 October 17 burst. Top panel: data and best-fit power-law model. Bottom panel: residuals in units of standard deviations.
Current usage metrics show cumulative count of Article Views (full-text article views including HTML views, PDF and ePub downloads, according to the available data) and Abstracts Views on Vision4Press platform.
Data correspond to usage on the plateform after 2015. The current usage metrics is available 48-96 hours after online publication and is updated daily on week days.
Initial download of the metrics may take a while.