Fig. 5
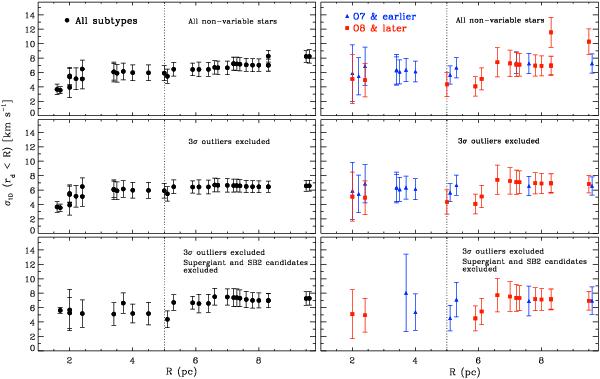
Observed line-of-sight velocity dispersion, as a function of R, for the stars within a projected radial distance R from the centre of R136. In the left panels, stars of all subtypes are included, while in the right panels, we divide them into two subsamples: O7 and earlier (blue triangles), O8 and later (red squares). In the top panels, all the non-variable stars (see Table 1) are included. In the middle panels, two stars with a radial velocity more than 3σ away from the mean RV are excluded. In the bottom panel, supergiant and SB2 candidates are also excluded. In each panel (and subsample), the first point from the left is the velocity dispersion of the four stars (of that subsample) closest to the centre, the second point is the velocity dispersion of the innermost five stars, and so on.
Current usage metrics show cumulative count of Article Views (full-text article views including HTML views, PDF and ePub downloads, according to the available data) and Abstracts Views on Vision4Press platform.
Data correspond to usage on the plateform after 2015. The current usage metrics is available 48-96 hours after online publication and is updated daily on week days.
Initial download of the metrics may take a while.