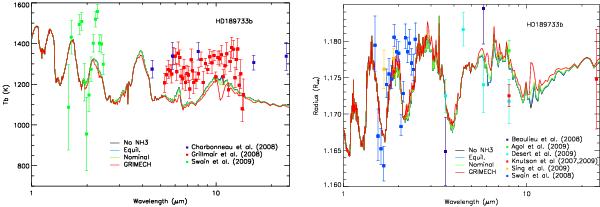
Fig. 10

Synthetic day-side (left) and transmission (right) spectra of HD 189733b with the nominal mechanism (green curve) compared to the one corresponding to the GRIMECH mechanism (red curve) and to the thermochemical equilibrium (blue curve). The dark curve is obtained when NH3 is removed from the model. The day-side fluxes are given as brightness temperatures (Tb). Because of the reflection component, note that the link between Tb and the atmospheric thermal profile is altered below 2 μm. The transmission spectrum is given as the apparent planetary radius. The data points obtained from various observations are also shown.
Current usage metrics show cumulative count of Article Views (full-text article views including HTML views, PDF and ePub downloads, according to the available data) and Abstracts Views on Vision4Press platform.
Data correspond to usage on the plateform after 2015. The current usage metrics is available 48-96 hours after online publication and is updated daily on week days.
Initial download of the metrics may take a while.


