Fig. 15
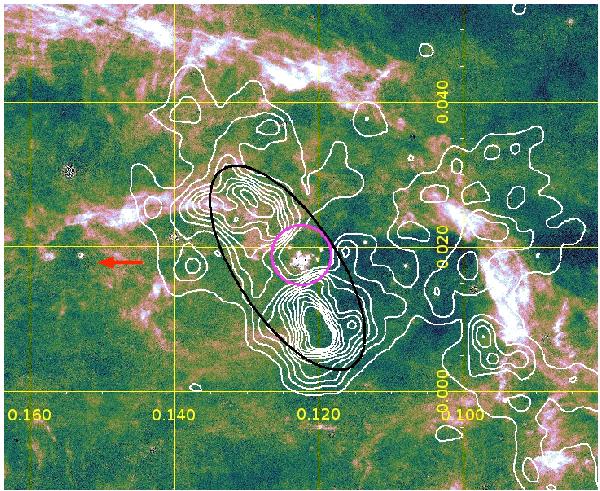
XMM-Newton/EPIC continuum-subtracted 6.4-keV line intensity contours (linearly spaced between 3 × 10⁻⁸ and 1.8 × 10⁻⁷ photons cm-2 s-1 arcmin-2) overlaid with an HST/NICMOS map in the H Paschen-α line (Wang et al. 2010; Dong et al. 2011). The axes of the map indicate Galactic coordinates in degrees. The black ellipse and the magenta circle show the two regions used for spectral extraction (see Fig. 10). The red arrow illustrates the observed proper motion of the Arches cluster, which is almost parallel to the Galactic plane (Stolte et al. 2008; Clarkson et al. 2012). North is up and east to the left.
Current usage metrics show cumulative count of Article Views (full-text article views including HTML views, PDF and ePub downloads, according to the available data) and Abstracts Views on Vision4Press platform.
Data correspond to usage on the plateform after 2015. The current usage metrics is available 48-96 hours after online publication and is updated daily on week days.
Initial download of the metrics may take a while.