Fig. 10
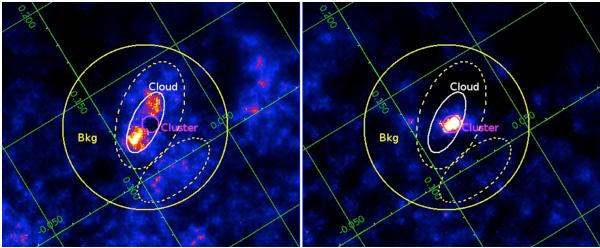
XMM-Newton/EPIC continuum-subtracted Fe Kα emission line maps of the Arches cluster region at 6.4 keV (left panel) and 6.7 keV (right panel). The images have been adaptively smoothed at a signal-to-noise of 20. The magenta circle indicates the region (“Cluster”) used to characterize the Arches cluster X-ray emission, which shows strong Fe Kα emission at 6.7 keV. The region inside the white ellipse but outside the magenta circle indicates the region (“Cloud”) used for spectral extraction to characterize the bright 6.4 keV regions surrounding the Arches cluster. The region inside the yellow circle but outside the two dashed ellipses shows the local background used for the spectral analysis. The axes of the maps (in green) indicate Galactic coordinates in degrees. North is up and east to the left.
Current usage metrics show cumulative count of Article Views (full-text article views including HTML views, PDF and ePub downloads, according to the available data) and Abstracts Views on Vision4Press platform.
Data correspond to usage on the plateform after 2015. The current usage metrics is available 48-96 hours after online publication and is updated daily on week days.
Initial download of the metrics may take a while.