| Issue |
A&A
Volume 546, October 2012
|
|
|---|---|---|
| Article Number | A35 | |
| Number of page(s) | 16 | |
| Section | Stellar structure and evolution | |
| DOI | https://doi.org/10.1051/0004-6361/201218987 | |
| Published online | 02 October 2012 | |
Spectral investigations of the nature of the Scorpius X-1 like sources⋆
1 School of Physics and Astronomy, University of Birmingham, Birmingham, B15 2TT, UK
e-mail: This email address is being protected from spambots. You need JavaScript enabled to view it.
2 Astronomical Observatory, Jagiellonian University, ul. Orla 171, 30-244 Cracow, Poland
Received: 8 February 2012
Accepted: 15 August 2012
Abstract
We present results of spectral investigations of the Sco X-1 like Z-track sources Sco X-1, GX 349+2, and GX 17+2 based on Rossi-XTE (RXTE) observations determining spectral evolution along the Z-track. Results are obtained for a spectral model describing an extended accretion disk corona. The results are compared with previous results for the Cyg X-2 like group: Cyg X-2, GX 340+0, and GX 5-1 and a general model for the Z-track sources proposed. On the normal branch, the Sco-like and Cyg-like sources are similar, the results indicating an increase of mass accretion rate Ṁ between soft and hard apex, not as in the standard view that this increases monotonically around the Z. In the Cyg-like sources, increasing Ṁ causes the neutron star temperature kT to increase from ~1 to ~2 keV. At the lower temperature, the radiation pressure is small, but at the higher kT, the emitted flux of the neutron star is several times super-Eddington and the high radiation pressure disrupts the inner disk and launches the relativistic jets observed on the upper normal and horizontal branches. In the Sco-like sources, the main physical difference is the high kT of more than 2 keV on all parts of the Z-track suggesting jets are always possible, even on the flaring branch. The flaring branch in the Cyg-like sources is associated with a release of energy on the neutron star consistent with unstable nuclear burning. The Sco-like sources are very different as flaring appears to be a combination of unstable burning and an increase of Ṁ which makes flaring much stronger. Analysis of 15 years of RXTE ASM data on all 6 classic Z-track sources shows the high rate and strength of flaring in the Sco-like sources suggesting that the continual release of energy heats the neutron star causing the high kT. Analysis of a Sco X-1 observation with unusually little flaring supports this. GX 17+2 appears to be transitional between the Cyg and Sco-like types. Our results do not support the suggestion that Cyg or Sco-like nature is determined by the luminosity.
Key words: accretion, accretion disks / acceleration of particles / binaries: close / stars: neutron / X-rays: binaries / X-rays: general
Tables 2–4 are available in electronic form at http://www.aanda.org
© ESO, 2012
1. Introduction
The Z-track sources form the brightest group of low mass X-ray binaries (LMXB) containing a neutron star, with luminosities at or above the Eddington limit. The sources display three tracks in hardness-intensity diagrams: the horizontal branch (HB), normal branch (NB) and flaring branch (FB) (Hasinger & van der Klis 1989) showing that major physical changes take place within the sources. However, the nature of these changes has not been understood and is essential to an understanding of LMXB in general. It has been widely thought that the physical changes are caused by change of the mass accretion rate along the Z-track (Priedhorsky et al. 1986), assumed to increase in the direction HB → NB → FB, however, the evidence for this is rather limited (below). Moreover, the variation of X-ray intensity does not suggest this, increasing on the HB, but then decreasing on the NB.
It was apparent that the sources fell into two groups (Kuulkers et al. 1997; Hasinger & van der Klis 1989): firstly, the Cyg-lke sources Cygnus X-2, GX 5-1 and GX 340+0 displaying full Z-tracks with HB, NB, and FB but having weak flaring. Secondly in the Sco X-1 like group: Sco X-1, GX 349+2 and GX 17+2 there is hardly any HB but flaring is strong and frequent with large increases of X-ray intensity. These substantial differences have not been understood.
The sources are important because of the observation of relativistic jets in the radio, notably the charting of outward motion of material from Sco X-1 by Fomalont et al. (2001) at a velocity v/c ~ 0.45. As jets are seen predominantly in the HB (e.g. Penninx 1989), X-ray observations allow us to compare conditions at the inner disk when jets are formed and are not formed, allowing us to investigate jet launching observationally as opposed to theoretically, aiming to understand the disk-jet connection.
Since the discovery of the sources as a class with three basic states (Schulz et al. 1989) there has been relatively little progress in understanding them. Extensive timing studies have been carried out (van der Klis et al. 1987; Hasinger et al. 1989) revealing complex behaviour of quasi-periodic oscillations (QPO) at low frequencies (~6 Hz) and at kilohertz frequencies; see review of van der Klis (2003). Spectral investigations may be more likely to provide an explanation, as revealing physical changes in the emission components during motion along the Z-track, but have been hindered by lack of agreement on spectral models.
1.1. The extended ADC
The broadband spectra exhibit both non-thermal and thermal emission, which have been interpreted using two very different physical models as have the spectra of LMXB in general. In the eastern model (Mitsuda et al. 1989), non-thermal emission originates in a small central region and thermal emission from the inner disk. It has been widely applied to the Z-track sources, however, there is no generally accepted physical interpretation of the resulting parameter variations.
The extended accretion disk corona model (Church & Bałucińska-Church 1995, 2004) was developed out of the original western model in which blackbody emission is from the neutron star and non-thermal emission is Comptonization from an ADC above the disk. The extended nature of the accretion disk corona (ADC) was revealed by work on the dipping class of LMXB, sources having high inclination such that decreases of X-ray intensity are seen in every binary orbit, due to absorption in the bulge in the outer disk where the accretion flow impacts (White & Swank 1982; Church et al. 1997).
The dipping sources strongly constrain emission models since spectra of non-dip and several levels of dipping must all be fitted. The gradual removal in dips of the dominant Comptonized emission over a time of order 100 s argues strongly for the emission being extended. Measurements of the dip ingress time in the dipping sources show that the ADC has radial sizes R of 10 000 to 700 000 km depending on luminosity, and is thin, i.e with a height H having H/R ≪ 1: a thin corona above a thin disk (Church & Bałucińska-Church 2004). The spectral evolution in dipping shows that the Comptonized emission is removed gradually by an extended absorber having increasing overlap with the extended source, again demonstrating the extended nature of the ADC. The extended ADC model gave very good fits to the complex spectral evolution in dipping in many observations of the dipping LMXB (Church et al. 1997, 1998a,b, 2005; Bałucińska-Church et al. 1999, 2000; Smale et al. 2001; Barnard et al. 2001). In addition it was able to fit the spectra of all types of LMXB in a survey made with ASCA (Church & Bałucińska-Church 2001) and so capable of describing sources of all inclinations.
Recently support for the extended ADC came from the Chandra grating results of Schulz et al. (2009) by an independent technique. Precise grating measurements revealed a wealth of emission lines of highly excited states (many H-like ions) such as Ne X, Mg XII, Si XIV, S XIV, S XVI, Fe XXV and Fe XXVI. The line widths seen as Doppler shifts due to orbital motion indicated emission in a hot ADC at radial positions between 18 000 and 110 000 km in good agreement with the overall ADC size from dip ingress timing.
In multi-wavelength observations of Cygnus X-2 in 2009 (Bałucińska-Church et al. 2011) a series of absorption edges below 1.4 keV remarkably had no detectable increase in depth during dips, showing that part of the continuum emission had to be extended so that part was not covered, while covered emission below 1.4 keV was completely removed.
Thus the evidence favours an extended ADC and this model has provided an explanation of the Cygnus X-2 sub-group (below) which seems convincing and has the potential to lead to a better understanding of the sources and jet formation. In the present work we test the hypothesis that the model can provide a physically reasonable explanation of the Sco X-1 like sub-group.
1.2. A model for the Cygnus X-2 like Z-track sources
We previously applied the extended ADC model to high-quality Rossi-XTE (RXTE) data on the Cyg-like sources GX 340+0 (Church et al. 2006, Paper I), GX 5-1 (Jackson et al. 2009, Paper II) and Cygnus X-2 (Bałucińska-Church et al. 2010, Paper III). In all cases the model fitted the spectra well at all positions on the Z-track, and clearly suggested a physical explanation for the Z-track phenomenon. All three sources behaved in the same way showing the explanation to be consistent. In this model, the Soft Apex between the NB and FB has a low mass accretion rate Ṁ and so a low X-ray intensity. Moving along the NB towards the Hard Apex, there is a strong increase in luminosity, 90% of which is due to the ADC Comptonized emission and it is difficult to see how this can happen without an increase of mass accretion rate. The resultant increase in kTBB from ~1 keV at the soft apex to ~2 keV at the hard apex and higher values still on the HB results in a large increase in  and so a large increase in the radiation pressure of the neutron star. The ratio f/fEdd: the flux emitted by unit area of the star f as a fraction of the Eddington value (
 , where RNS is the radius of the neutron star) increases from ~0.3 at the soft apex to 3 times super-Eddington on the HB. The good correlation of high radiation pressure with the radio emission of jets on this part of the Z-track led us to suggest that high radiation pressure disrupts the inner disk deflecting the accretion flow vertically so launching the jets.
On the HB LADC decreases suggesting Ṁ decreases while kTBB continues to rise. It is not definite what happens: Ṁ may be decreasing in the disk affecting LADC but not yet reaching the neutron star; alternatively, the high radiation pressure may be disrupting the disk out to larger radial positions so reducing the Comptonized emission.
In flaring, LADC was constant, suggesting that Ṁ was constant, but there is a strong increase in LBB. If Ṁ does not change, flaring must be due to an additional energy source on the neutron star, i.e. unstable nuclear burning. Support for this came from measured values of the mass accretion rate per unit emitting area on the neutron star ṁ, the critical parameter in the theory of stable/unstable burning on the surface of the neutron star (e.g. Bildsten 1998). The theory describes various régimes of stable and unstable nuclear burning over the wide range of luminosities found in LMXB, including unstable burning at lower luminosities seen as X-ray bursts but is also applicable at the luminosities of the Z-sources. In all three sources, ṁ at the onset of flaring (the soft apex) agreed with the theoretical critical value below which there is unstable helium burning.
1.3. A monotonic variation of mass accretion rate?
This model for the Cygnus X-2 like sources with Ṁ increasing on the NB and constant on the FB does not support the standard view that Ṁ increases monotonically HB → NB → FB. In a multi-wavelength campaign on Cyg X-2 (Hasinger et al. 1990), an increase of UV emission (Vrtilek et al. 1990) in what appeared to be flaring suggested an Ṁ increase. However, there has been some confusion in the Cyg-like sources between dipping and flaring in that reductions in X-ray intensity in dipping (seen in hardness-intensity) when plotted in colour-colour look like a FB. In Cyg X-2 recent multi-wavelength observations show that intensity reductions were indeed absorption dips unrelated to flaring (Bałucińska-Church et al. 2011, 2012). In GX 340+0 and GX 5-1, a 4th track has been seen at the end of the FB with decreasing intensity suggesting a dipping-flaring link. However, spectral fitting has shown that this was not absorption but a reduction in the Comptonized emission level (Church et al. 2010). Thus the original evidence for the monotonic increase of Ṁ becomes questionable.
Support for the monotonic increase of Ṁ was found in the timing properties of the sources with many properties correlating with Z-track position, i.e. arc length S along the track. However, in recent years authors have found several properties that do not correlate (Wijnands et al. 1996; Homan et al. 2002; Casella et al. 2006; Dieters & van der Klis 2000) so that S is not a measure of Ṁ.
In our model for the Cyg-like sources, it is proposed that Ṁ increases between the soft and hard apex. In the present work we will test this proposal in the case of the Sco X-1 like sources, and find that this is also the case.
1.4. Approach of the present work
In this work, we test the hypothesis that the extended ADC model can describe the Sco X-1 like sources, provide a physically reasonable explanation of them and of the differences between these and the Cyg-like sources.
It is applied in the form bb + cpl where bb is simple blackbody emission of the neutron star and cpl is a cut-off power law representing Comptonization in an extended corona. As discussed in detail in Sect. 3.3, the model was applied with a fixed power law photon index of 1.7 and a free column density (except for Sco X-1). The bb + cpl spectral form is appropriate to Comptonization of seed photons from the disk below the ADC which at large radial positions have low energies (kT ~ 0.1 keV or less); see Church & Bałucińska-Church (2004) for a full discussion. A simple blackbody model is used and we have not previously found any evidence for departure from this form. Theoretical treatments of electron scattering in the neutron star atmosphere require measured blackbody temperatures to be corrected. Observational evidence for a modified blackbody is somewhat limited as discussed in Bałucińska-Church et al. (2001) who show that whether modification is important depends critically on the electron density which is poorly known. However, we show in Sect. 3.4 that this correction combines with the relativistic correction to have a relatively small effect on the blackbody temperature and radius.
1.5. The sources: Sco X-1, GX 349+2 and GX 17+2
Sco X-1 is the brightest persistent X-ray source in the sky (Giacconi et al. 1962) at a distance of 2.8 ± 0.3 kpc (Bradshaw et al. 1999) and has been studied intensively since the early 1960s, including multi-wavelength campaigns (Canizares et al. 1975; Hertz et al. 1992). It has an orbital period of 18.9 h (Cowley & Crampton 1975) and a M type companion of mass 0.4 M⊙ (Steeghs & Casares 2002). Spectral modelling of Sco X-1 (e.g. White et al. 1985) showed that the spectra could be fitted by a blackbody plus Comptonization model. The third branch, the horizontal branch, was discovered by Hasinger et al. (1989) using Exosat. The first kHz QPO was discovered in this source by van der Klis et al. (1996).
GX 349+2 is relatively little studied but has a similar period of 21.85 ± 0.4 h (Wachter & Margon 1996). It has not been seen in the HB. A distance of 9.2 kpc was found by Penninx (1989) and van Paradijs & White (1995; see also Grimm et al. 2002). Zhang et al. (1998) discovered kHz QPO on the upper normal branch at 712 and 978 Hz. Iaria et al. (2004) found emission features probably L-shell emission of Fe XXIV, Ly α S XVI and Fe XXV.
GX 17+2 appeared as a source with two branches (the NB and HB) in hardness-intensity (Schulz et al. 1989). A strong FB was seen by Hasinger & van der Klis (1989). The companion was difficult to identify (Deutsch et al. 1999; Callanan et al. 2002). Investigations of the variation around the Z-track of low frequency QPO were carried out by Langmeier et al. (1990), Kuulkers et al. (1997) and Homan et al. (2002). Kilohertz QPO were discovered by Wijnands et al. (1997). It is one of the two Z-track sources with occasional X-ray bursts: GX 17+2 and Cyg X-2 (Kahn & Grindlay 1984; Tawara et al. 1984; Sztajno et al. 1986; Kuulkers et al. 1997, 2002). Migliari et al. (2007) from simultaneous radio and X-ray observations show the switch-on of the jet on the normal branch. Distances of about 7.5 kpc were found by several authors (e.g. Ebisuzaki et al. 1984); distances used in the analysis following are given in Table 6 and further discussed in Sect. 4.5.
2. Observations and analysis
All three sources have been observed on multiple occasions with RXTE. We examined the data in the HEASARC archive remotely producing hardness-intensity plots and selected the best quality data, i.e. data which spanned as much as possible of a full Z-track. In the Sco-like sources most observations contain flaring, but few also have normal and horizontal branch data. In the case of GX 17+2, a full Z-track was available. It is also important not to use data in which sideways or secular movement of the Z-track takes place as we are interested in changes taking place around a single Z-track. The observations chosen are shown in Table 1.
The Rossi-XTE observations.
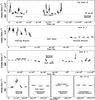 |
Fig. 1 Lightcurves from the Rossi-XTE PCA, background-subtracted and deadtime-corrected of the 3 sources with 64 s binning. Upper panel: GX 349+2; upper middle panel: typical Sco X-1 data with strong flaring; lower middle panel: Sco X-1 in an exceptionally flare-free state; lower panel: GX 17+2; the gaps between the 4 sub-observations are removed for clarity. |
We previously published results on Sco X-1 for a typical observation dominated by strong flaring (P30036) made in 1998, Jan. 7–8 spanning 120 ks (Barnard et al. 2003). A major part of the present work relates to the effects of strong flaring seen in the Sco X-1 like sources, and to investigate this we searched the HEASARC archive for Sco X-1 data in which there was substantially less flaring, if such data could be found. In the observation chosen for analysis (obsid P40706) there was a large gap of at least 150 ks from any previous major flare, and we compare results for this with a reanalysis of the 1998 observation using the same improved calibration data. This observation was also analysed by Bradshaw et al. (2003) using a different spectral approach.
In observations of all three sources, data from both the Proportional Counter Array (PCA, Jahoda et al. 1996) and the high-energy X-ray timing experiment (HEXTE) were used. The PCA was in Standard2 mode with 16 s resolution and examination of the housekeeping data revealed the number of the xenon proportional counter units (PCUs) that were reliably on during each observation. In GX 349+2 and GX 17+2 all 5 PCUs were reliably on and data used from all of these with both left and right detectors. In both observations of Sco X-1, data from a single PCU and a single detector were used as the count rate was already high, and similar to that in the other sources because the source distance is ~3 times less. Standard screening criteria based on the housekeeping data were applied to select data having an offset between the source and telescope pointing of less than 0.02° and elevation above the Earth’s limb greater than 10°. Data were extracted from the top layer of the detector. Analysis was carried out using the ftools 6.9 package. The P40076 observation of Sco X-1 was made in Epoch 4 of the mission (1999 March 22–2000 May 13) relevant to channel-energy conversion and also to calculation of background data from appropriate models. The other sources were observed in Epoch 3 (1996 April 15–1999 March 22). Total PCA lightcurves were extracted to correspond as closely as possible to the band 2.0–18.5 keV for all observations by selecting appropriate channel ranges. Lightcurves were generated and background files for each PCA data file were produced using the facility pcabackest, applying the latest “bright” background models appropriate to Epoch 3 or Epoch 4 for background subtraction of the lightcurves. Deadtime correction was carried out on both source and background files prior to background subtraction and lightcurves with 64 s binning are shown in Fig. 1.
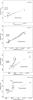 |
Fig. 2 Z-track of the observation derived from background subtracted and deadtime corrected lightcurves with 64 s binning. The boxes show the ranges of intensity and hardness ratio used for the selection of PCA and HEXTE spectra. |
In each source an identification of the subsections of data in the lightcurve with branches of the Z-track was made by selecting each of these sections with the ftool maketime and making a hardness-intensity plot of the selected data to find where it lay on the overall Z-track. This allowed the sections of the lightcurves to be labelled as HB, NB or FB.
Lightcurves were also made in sub-bands of the above range, corresponding to energies 2.0–4.1 keV, 4.1–7.3 and 7.3–18.5 keV for Epoch 3 data, and as close to these as possible in Epoch 4 by careful choice of channels. A hardness ratio was defined as the ratio of the intensity in the band 7.3–18.5 keV to that in the 4.1–7.3 keV band. The resulting Z-tracks of hardness versus total intensity are shown in Fig. 2. The rebinning of the lightcurves from 16 s to 64 s was done to produce the relatively narrow width of the Z-track, as previous work has shown it is important to select data along the centre of the Z-track so spectral changes reflect changes along the track and not perpendicular to it (Barnard et al. 2003). Superimposed on the Z-tracks are boxes showing the selection of spectral data (below).
HEXTE data were also extracted as lightcurves and spectra from a single cluster of the HEXTE instrument using hxtlcurve which also provided background files, and deadtime correction was made. This allowed simultaneous fitting of PCA and HEXTE spectra, the wider energy band resulting in spectral fitting being better constrained than with the PCA alone.
3. Results
3.1. Lightcurves
Figure 1 shows the lightcurves of the three sources, including the two observations of Sco X-1. In GX 349+2 and the 1998 observation of Sco X-1 (upper middle panel), the prevalence of strong flaring can be seen. By remotely scanning all of the archival RXTE data on Sco X-1 it is clear that the source is essentially flaring most of the time. The 1999 observation of Sco X-1 (lower middle panel) is highly unusual. It was chosen from all of the observations of Sco X-1 made during the 15 year life of the mission to be one of the few having a long period without flaring. Only towards the end of the observation, is a strong flare seen with a factor of two increase of intensity. The lightcurve is shown for clarity without additional data spanning 120 ks before the data shown, during which only a weak flare was seen. The data analysed between 0 and 110 ks appears free from flaring and even if flaring occurred immediately before the additional data, the data analysed are ~150 ks or more later. This observation of Sco X-1 was made with an offset pointing (24′ ) as is common with this very bright source, so the count rate is reduced. In the case of GX 17+2, relatively little flaring can be seen, typical of the source, and this will be demonstrated and discussed later, it appearing that the source is transitional between the Sco-like and the Cyg-like sources.
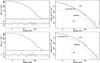 |
Fig. 3 Best fit spectra for GX 17+2 in the NB (top; spectrum n2) and FB (bottom; spectrum f5), showing the folded data (left) with residuals and unfolded data (right). The error bars are generally too small to be visible. Model components are labelled in the unfolded spectra. |
3.2. Z-tracks
In Fig. 2 we show the Z-tracks of the 4 observations as hardness-intensity diagrams; the intensities are both background-subtracted and deadtime corrected. The observation of Sco X-1 with strong flaring is shown as the upper central panel while that with little flaring is in the lower central panel. It can be seen that in GX 349+2 and the flaring Sco X-1 observation the horizontal branch is missing as is typical of the Sco-like sources. In the reduced flaring Sco X-1 observation, much more of the Z-track is present but it is difficult to locate the hard apex exactly as the track is vertical in this region. In GX 17+2 the Z-track is complete, and flaring less persistent which as discussed later is a characteristic of this source which is more similar to the Cyg X-2 like group. PCA spectra were extracted in each case at several positions along the Z-track within hardness-intensity boxes by use of a good time interval (GTI) for each selection. The intensity ranges were typically 100 count s-1 wide and hardness ranges such as 0.480–0.485 were used. It was checked that the selections were correct by overlaying the selected data on the full Z-track. A typical PCA spectrum at a mid-range intensity contains ~10 Million counts equivalent to ~1500 s of data so that high quality spectral fitting could be carried out. Background spectra were produced for each selection and source and background spectra deadtime-corrected using local software pcadead. Pulse pileup had negligible effect on the spectra in general and was not carried out except in the case of the Sco X-1 observations. It was not necessary to re-group channels to a minimum count to allow use of the χ2 statistic as the count in primitive channels was already high. A systematic error of 1.0% was added to each channel as is usual for PCA data. Response files appropriate to each observation were generated using pcarsp and the offset pointing in the P40706 observation of Sco X-1 taken into account.
HEXTE source and background spectra were extracted using the same GTI files as for the PCA and deadtime corrected using hxtlcurv. A standard auxiliary response file (arf) and response matrix file (rmf) were used. The rmf file was rebinned to match the actual number of HEXTE channels using rddescr and rbnrmf. The source + background spectra were compared with the background spectra for both the PCA and HEXTE, and spectral fitting carried out only up to the energy where these became equal, typically 22 keV in the PCA and 40 keV in HEXTE.
GX 17+2 spectral fitting results.
3.3. Spectral analysis
The motivation of this work is to test the hypothesis that the extended ADC model may provide good fits to the spectra of the Sco X-1 like Z-track sources, and the model was applied in the form abs ∗ (bb + cpl) (Sect. 1) where abs is the wabs absorption term in Xspec.
PCA and HEXTE spectra were fitted simultaneously allowing a variable normalization between the instruments with parameter values chained between the PCA and HEXTE. The lower energy limit of the PCA, usually set in spectral fitting at ~3 keV, does not allow accurate determination of low values of the column density. However, in GX 349+2 and GX 17+2, NH values larger than 3 × 10²² atom cm-2 were obtained by spectral fitting and there is no problem in measuring such values. In the case of Sco X-1, the column density is much smaller and was fixed at 0.3 × 10²²atom cm-2 which was found to give good quality fits, although reducing the value further made little difference to the fitting. In GX 349+2, NH at the soft apex is about 10 times larger than the Galactic value of ~0.6 × 10²²atom cm-2 (Dickey & Lockman 1990; Kalberla et al. 2005), and in GX 17+2, NH is several times larger than the Galactic ~0.9 × 10²²atom cm-2. This was also found in our previous work on the Cygnus X-2 like sources suggesting that there is intrinsic absorption. Such higher values have been found previously in Z-track sources (Christian & Swank 1997).
It is well-known that the spectra of the Z-track sources have a low Comptonization cut-off energy of a few keV, which restricts the energy range available for determination of the power law photon index Γ. We have taken the approach previously adopted (Papers I–III) of fixing Γ at 1.7, which seems to be optimum for fitting. This procedure gave good quality spectral fits and if Γ was freed, the value stayed close to 1.7. Extensive testing has shown that the value of power law index did not affect the pattern of variation of spectral parameters along the Z-track. In all three sources, initial fitting revealed excess emission in the residuals and an Fe line was added to the model. In GX 349+2 an additional edge feature at an energy of about 10 keV was clearly present and was added to the model. An edge feature at ~9 keV was seen previously by di Salvo et al. (2001). Final fitting results are shown in Tables 2–5 for the four observations analysed and representative spectral fits are shown in Fig. 3.
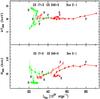 |
Fig. 4 The neutron star blackbody emission in the Sco-like sources: GX 17+2: green filled squares, GX 349+2: red open circles, Sco X-1: red filled circles. Upper panel: the blackbody temperature; lower panel: the blackbody radius. Results are shown only for the observation of Sco X-1 in its normal state with strong flaring (obsid P30036). The branches are labelled H (horizontal), N (normal) and F (flaring). In the electronic version of the paper, sources are shown with individual colours. |
3.4. Variation of the neutron star emission around the Z-track
We now present results for the three Sco X-1like sources, using at this stage only the observation that is typical of Sco X-1 with strong flaring. We concentrate on the properties of the continuum emission. In Fig. 4 we show the variation of the blackbody temperature kTBB and blackbody radius RBB around the Z-track as a function of the total 1–30 keV luminosity (the sum of the blackbody, Comptonized emission and any line present). Results are presented as derived from spectral fitting without making a correction for general relativity as we wish to make comparisons between the Sco-like and the Cyg-like sources as directly as possible. At the soft apex between NB and FB, kTBB is lower in all sources than on the NB, increasing on the normal branch and in the case of GX 17+2 which has a horizontal branch, also increasing on that. In Sco X-1 and GX 349+2, kTBB remains always greater than 2 keV, staying about constant in flaring, while in GX 17+2 this temperature is reached at flare peaks and on the upper NB.
The blackbody radius RBB shown in Fig. 4 is defined by  where LBB is the blackbody luminosity and σ is Stefan’s constant. It can be seen that the values at the soft apex are depressed well below higher values found at other parts of the Z-track showing that the whole neutron star is not emitting.
If we assume that both a relativistic correction and a colour correction for modification of the blackbody by scattering in the neutron star atmosphere should be made (but see Sect. 1.4) the corrected temperature Teff = Tc × (1 + z)/fc where Tc is the measured temperature. Using an appropriate colour correction of ~ 1.45 (Suleimanov et al. 2011), and (1 + z) = 1.34, the overall correction would be only 9%. The blackbody radius is corrected by  so that the real value would be 1.6 times larger than that measured.
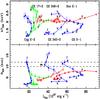 |
Fig. 5 Comparison of the Sco X-1 like sources with the Cyg X-2like sources. In all figures the Cyg-like sources will be shown as blue filled circles; GX 349+2 will have red open circles and Sco X-1 red filled circles. The nominally Sco-like source GX 17+2 will be shown with green filled squares to emphasize its transitional nature with some characteristics Cyg-like and some Sco-like. To help distinguish between the sub-groups of sources, Sco-like sources have branch labels: H, N and F while Cyg-like sources use h, n and f. |
In Fig. 5 the results for the Sco-like sources are compared with those previously obtained for the Cyg-like sources. In all cases appropriate source distances from the literature as shown in Table 6 are used to determine luminosities. In the Sco-like sources, kTBB increases on the NB and HB (when present) as was previously found in the three Cygnus X-2 like sources: Cygnus X-2, GX 340+0 and GX 5-1 (Papers I–III). However, the major difference between the Sco-like and Cyg-like sources is clearly the substantially higher kTBB at all parts of the Z-track in the Sco-like sources. We will suggest that this has a major effect on the inner disk. GX 17+2 appears transitional between the two types, having a lower kTBB at the soft apex but also having the strong flaring of the Sco-like sources. The presence of a full Z-track is also a feature of the Cyg-like sources.
The blackbody radius RBB in the Cyg-like sources is generally larger than in the Sco-like sources and has a maximum value on the Z-track excluding flaring (discussed later) at the soft apex between 10–12 km as shown by the dashed lines. Although this is uncorrected it does suggest that emission is from the whole neutron star at the soft apex. On the NB and HB, RBB decreases implying that the emission contracts to an equatorial belt on the neutron star. It was proposed in our model for the Cyg-like group (Papers I–III) that increasing radiation pressure of the neutron star on the NB and HB due to high kTBB ~ 2 keV disrupted the inner disk removing material above the orbital plane making the disk thinner. This is expected to lead to accretion over a reduced equatorial part of the neutron star. The details of the flow between inner disk and star are not well established, however, there are two possibilities. In the Inogamov & Sunyaev model (1999) the accretion flow adjusts to the spin of the star on the stellar surface producing X-ray emission from a strip of height that depends on Ṁ. If accretion flow is diverted away from the neutron star, the emitting area gets less. Alternatively, in a survey of LMXB with ASCA, the height of the emitting strip was found to equal the height of the inner disk (Church & Bałucińska-Church 2001) so that reduced disk height will mean reduced strip height. This equality could be explained either by the Inogamov & Sunyaev model, or possibly by some form of radial flow between disk and star.
Source distances used in analysis.
In Sco X-1 and GX 349+2, a similar high kTBB > 2 keV is found at the soft apex and the blackbody radius is reduced to a few km, which is consistent with the Cyg-like source model. In GX 17+2, the blackbody radius is ~8 km, kTBB being lower than in the other two sources.
The second major difference between the two groups is in flaring. Figure 5 clearly demonstrates the well-known fact that flaring in the Cyg-like sources is weak but strong in the Sco-like sources. In Sco X-1 and GX 349+2, RBB increases in flaring suggesting that the emitting area spreads from an equatorial belt across the neutron star. In the Cyg-like sources there is similarly an increase of RBB indicating that in this case the emission may expand outside the neutron star as in radius-expansion bursts.
The major spectral and implied physical changes in flaring between the two groups are very apparent in the variation of luminosities of the individual blackbody and Comptonized emission components shown next.
3.5. Variation of the blackbody and Comptonized emission luminosities
Figure 6 shows the variation of the bolometric neutron star blackbody luminosity: LBB and the 1–30 keV Comptonized emission of the ADC: LADC with the total luminosity LTot for the Sco-like sources. These can provide valuable insights into the physical changes taking place. Firstly, in all sources, LADC is dominant, the blackbody being only 10% of the total luminosity at the soft apex, but increasing to ~25% at the peak of flaring in GX 349+2 and Sco X-1, and in these sources LBB becomes itself super-Eddington at that point.
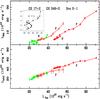 |
Fig. 6 Variation of the blackbody luminosity (upper panel) and ADC luminosity (lower panel) around the Z-track in the Sco-like sources. To improve clarity, an expanded view of GX 17+2 is given in the inset. |
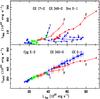 |
Fig. 7 Comparison of the Sco X-1 like sources with the Cyg X-2 like sources. |
In Fig. 7, the Sco-like sources are compared with the Cyg-like sources. In these, a large increase of the Comptonized emission luminosity is seen on the NB between the soft apex and the hard apex, suggesting that the mass accretion rate Ṁ increases, based on the improbability of the ADC emission increasing strongly without Ṁ increasing. On the FB, LADC is constant within errors, while LBB increases suggesting Ṁ is constant and the additional luminosity is generated on the neutron star, which we proposed was unstable nuclear burning (Papers I–III).
The Sco-like sources follow closely the same linear variation of LADC with LTot as expected given that LADC is the dominant emission in both sub-groups. However, there is a large increase of LADC in flaring, very different from the Cyg-like sources. There is also a large increase in LBB. This indicates that flaring in the Sco-like sources may consist of unstable burning combined with Ṁ increase as proposed in the Discussion.
3.6. Radiation pressure
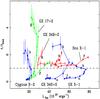 |
Fig. 8 The emissive flux f of unit area of the neutron star as a fraction of the Eddington flux fEdd for the Sco X-1 like sources compared with the Cyg X-2 like sources. |
In Fig. 8 we show the blackbody emissive flux of unit area of the neutron star f obtained directly from spectral fitting and equal to  , so that it is the flux of unit emitting area. In the figure, it is shown as a fraction of the Eddington flux fEdd =
  , where RNS is the actual radius of the neutron star, with fEdd ~ 1.4 × 1025 erg cm-2 s-1 for an assumed 10 km radius. This ratio f/fEdd expresses the strength of the radiation pressure in the neighbourhood of the neutron star showing whether the emission from the emitting part of the stellar surface is super-Eddington. It is more useful when the emission is not from the whole star than L/LEdd which shows whether the source as a whole appears super-Eddington to a more distant observer and is thus an average. f/fEdd can be substantially greater than unity when L/LEdd is not.
The behaviour of the Cyg-like sources (Papers I–III) is characterised by low values of f/fEdd at the soft apex with little change on the weak flaring branches. However, on the NB the ratio rises to unity at the hard apex due to the increase of kTBB and increases further on the HB. As this is obtained directly from spectral fitting it is clear that the radiation pressure close to the neutron star becomes high as the ratio becomes several times super-Eddington. Disruption of the inner accretion disk should therefore be expected as proposed in our model of the Cyg-like sources.
In GX 349+2 and Sco X-1, it can be seen that f/fEdd is always greater than unity, as a consequence of the blackbody temperature never dropping below 2 keV. Thus these main Sco-like sources have the major physical difference that radiation pressure is always high which must have a strong effect on the inner regions of the binary. GX 17+2 is more similar to the Cyg-like sources: sub-Eddington at the soft apex becoming super-Eddington on the NB. As noted before, there is however, strong flaring as in the Sco-like sources.
It is interesting to see that kTBB (Fig. 5) has a value of ≥ 2 keV in Sco X-1 and GX 349+2 at all times and in the Cyg-like sources at the hard apex, and in all these cases f ~ fEdd as a result. Thus the neutron star has about the Eddington temperature kTEdd ~ 2 keV at these positions as might be expected.
3.7. Nuclear burning
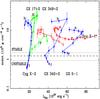 |
Fig. 9 Values of the measured mass accretion rate per unit area to the neutron star compared with the theoretical critical value ṁST demarcating regimes of unstable and stable burning (Bildsten 1998) shown as a dashed line. The dotted lines show the 30% uncertainty attached to the theoretical value. |
In Fig. 9 we compare conditions at the onset of flaring, i.e. at the soft apex, with the theory of stable and unstable nuclear burning in the atmosphere of the neutron star. The critical parameter in the theory is the mass accretion rate per unit area of the star ṁ which for the wide range of the total mass accretion rate Ṁ found in LMXB defines several régimes of stable and unstable burning of H or He (Fujimoto et al. 1981; Fushiki & Lamb 1987; Bildsten 1998; Schatz et al. 1999). ṁ determines physical conditions in a column of the neutron star atmosphere above unit area and so whether nuclear burning is stable or not. We evaluate ṁ as the mass accretion rate per unit emitting area of the neutron star given by  using RBB from spectral fitting, and Ṁ obtained from the total luminosity by standard accretion theory.
In the Cyg-like sources, it can be seen in Fig. 9 that the values of ṁ at the soft apex agree well with the critical theoretical ṁST (Bildsten 1998) at the boundary of unstable and stable He burning shown by the dashed line (with the 30% theoretical uncertainty shown as dotted lines). This provides evidence that flaring in these sources consists of unstable nuclear burning (Papers I–III).
In Sco X-1 and GX 349+2, the values of ṁ do not agree well with ṁST and are located some way into the stable region, several times higher than the critical value (but not orders of magnitude away). It is clear that flaring in these sources has a different character which will be discussed below. GX 17+2 is again Cyg-like in this respect.
3.8. ASM observations: the predominance of flaring in the Sco-like sources
To help in a physical understanding of the differences between the Cyg and Sco-like sources, we investigate quantitatively the differences in flaring behaviour using RXTE All Sky Monitor (ASM) data. Lightcurves of all six sources were extracted over a ~15-year period from 1996, Jan. 6 to 2010, Nov. 30 as shown in Fig. 10. Data were accumulated in 90 second dwells several times per day. This immediately demonstrates the predominance of flaring in the Sco-like sources (lower panel). In Cygnus X-2, the peaks visible are maxima in longterm variability at tens of days and not flares. The figure reveals extensive variability clearly unconnected with Poisson noise. In Sco X-1, for a 90 s bin and 1000 count s-1, Poisson variations are 0.3%; in the other sources with ~50 count s-1 the level is 1.5%.
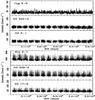 |
Fig. 10 Comparison of flaring in the Sco-like and Cyg-like sources using 15 years of RXTE All SKy Monitor data. The peaks in the Cyg X-2 lightcurve are due to source variability, not flaring (see text). |
In Cyg X-2 we examined all pointed observations within the ASM lightcurve. By extracting lightcurves and Z-tracks in hardness-intensity we identified position on the Z-track in these parts of the ASM data. Variations on a timescale of about 2 days were identified as Z-track movement. A variation over about 40 days could also be seen possibly associated with secular motion of the Z-track (giving larger peaks in the 15-year lightcurve). Gaps in the ASM data reflect periods when the source had less coverage by the satellite. We were able to identify the hard apex in the Cyg-like sources as peaks in the two-day cycle and also in some cases the soft apex. However, the occurrence of flaring in pointed observations is rare and it is difficult to find FB data without pointed observations as there is a limited increase in intensity.
By contrast, in Sco X-1, the X-ray count rate at the peak of flares is much greater than at the hard apex, so the frequent peaks in the lightcurve (intensity > 1100 count s-1) can clearly be identified as flaring. The data were analysed using local software to detect flares and identify the peak of each. Broader flares exhibit structure appearing to be a superposition of flares and it was assumed that peaks in the lightcurve less than 0.1 day apart represented structure and not the next flare. A lightcurve of detected flares (with their appropriate count rates from the original lightcurve) was made. Careful examination of the flares detected in this way showed that the gaps between adjacent flares vary between ~0.2 and ~2.5 days for the majority of flares. Only ~40 flares had much larger spacings of 10 days in the 15 years of data. In GX 349+2 and GX 17+2, lower limit of 60 and 55 count s-1 were applied in flare detection. In GX 349+2, the majority of flares were spaced at less than 1.5 days and few spacings (~5) of 10 days were seen. In GX 17+2, most flares were less than 4 days apart but there were ~85 flares with a spacing of 10 days.
The total numbers of flares found in the 15 years of ASM data defined on the above criteria was 3013 in Sco X-1, 3523 in GX 349+2 and 1226 in GX 17+2. Dividing by the duration of the observations gives the mean flare rates and so the mean intervals between flares of 1.68 days, 1.44 days and 4.14 days in the three sources, respectively. There are about three times less flares in GX 17+2 as is obvious in the lightcurves supporting the idea that the source is transitional between Sco-like and Cyg-like.
The results show clearly the strength of flaring in the Sco-like sources Sco X-1 and GX 349+2 particularly. We will suggest (Sect. 4.2) that this causes the main physical difference of high neutron star temperature in these sources.
3.9. Sco X-1 in a state of reduced flaring
Finally we show results of analysis of the observation of Sco X-1 selected to have much reduced flaring. The lightcurve of this observation was shown in Fig. 2 and as noted earlier, the bulk of this observation consists of 110 ks on the HB or NB without apparent flaring, and preceded by 120 ks without strong flaring (not shown) so that the data analysed are at least ~150 ks from any previous strong flare. Figure 3 shows the Z-track in hardness-intensity (lower central panel) which is remarkable in having not only a normal branch but also a hard apex at about the end of the Z-track. The major flare at a time of ~120 ks seen in the Z-track occurred after the bulk of the observation on the HB and NB so did not affect spectra selected in those regions.
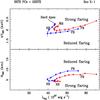 |
Fig. 11 Comparison of blackbody temperature and radius for the two observations of Sco X-1, one having strong flaring as normal, and the other during reduced flaring. |
Spectra were selected along the Z-track and spectral analysis carried out as described previously. Figure 11 shows the most significant result: the blackbody temperature and blackbody radius compared with the observation of Sco X-1 with strong flaring. The blackbody temperature kTBB increases on the normal branch as seen in all Z-track sources.
A reduction in kTBB is seen in the observation with reduced flaring at all points on the flaring branch and the soft apex. Here, the value of kTBB = 1.83 ± 0.14 compared with 2.06 ± 0.09 keV in the flaring observation is significantly different at the 2σ level. However, on considering all of the FB data, the significance of the decrease in kTBB becomes higher. In many observations of Sco X-1 analysed by us, the value of kTBB is more than 2 keV so the value of 1.83 keV is quite unusual. The analysis provides evidence that the usual high value of kTBB is associated with the frequent and strong flaring in this source, and we propose below that it is the strong flaring in the Sco-like sources that almost always maintains a high blackbody temperature giving rise to the observed spectral properties.
The blackbody radius RBB increases in flaring in both observations increasing towards the neutron star radius at the peak of flaring, as noted previously by Barnard et al. (2001).
4. Discussion
4.1. Differences between the Sco X-1 like and the Cyg X-2 like sources
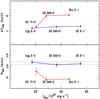 |
Fig. 12 The major difference between the Sco X-1 like and Cyg X-2 like sources at the soft apex; upper panel: the blackbody temperature kTBB; lower panel: the corresponding blackbody radii RBB. The dotted lines correspond to the upper and lower limits of the average RBB for the three Cyg-like sources of 11.6 ± 0.6 km at 90% confidence. |
On the normal branch, the Sco-like and Cyg-like sources are similar. In the latter, we suggested that the large increase of LADC was due to increasing mass accretion rate. LADC also increases in the Sco-like sources on the NB (Fig. 7) supporting the idea that Ṁ increases on the NB in all Z-track sources, unlike the often-held standard view that Ṁ increases monotonically in the opposite direction HB → NB → FB.
The neutron star temperature in the Cyg-like sources is lowest at the soft apex and the blackbody radius maximum (for the non-flaring source) suggesting that the whole star is emitting. The average value for the 3 sources is 11.6 ± 0.6 km, but should not be taken literally as the neutron star radius. Firstly, a relativistic correction (1 + z) of 34% would reduce the value to 8.7 km. Also applying a colour correction (Sect. 3.4) would however, increase the final value to 18.7 ± 0.97 km which is disturbingly high. In addition there may be possible systematic effects such as blocking of part of the neutron star emission by the disk or corona, although this is not generally seen in LMXB except in dipping. Cygnus X-2 is the only source with dipping and high inclination; however, RBB at the soft apex in this source does not appear different from the other Cyg-like sources.
It was proposed that increasing radiation pressure on the NB disrupted the inner disk leading to accretion on an equatorial belt, and possible mechanisms for this suggested (Paper I).
In Sco X-1 and GX 349+2, kTBB is substantially higher, this constituting the first major difference, and RBB is reduced. To emphasize the differences in Fig. 12 we show kTBB and RBB for all 6 sources at the soft apex. The reduction of RBB in the Sco-like sources at the soft apex with higher kTBB is consistent with the reduction in the Cyg-like sources with increasing kTBB on the NB.
Closely related is the radiation pressure of the neutron star emission expressed via f/fEdd using the measured flux (Fig. 8). In Sco X-1 and GX 349+2 the values are always super-Eddington whereas the Cyg-like sources have sub-Eddington values at the soft apex becoming high at the hard apex where jets are observed. Thus in Sco X-1and GX 349+2 in which the radiation pressure is always high we expect the sources to be permanently subject to disruption of the inner disk and jet launching may take place even from the soft apex although f/fEdd is only unity. Whether this occurs requires simultaneous radio and X-ray observations during Z-track movement. We might also possibly expect jets during flaring on the basis that f/fEdd remains high.
GX 17+2 appears transitional not having a high kTBB at the soft apex nor a very reduced RBB. Flaring is however, similar to that in Sco X-1 and GX 349+2 with a definite increase of Comptonized emission.
The second major difference is in flaring. The Cyg-like sources have constant LADC arguing for a constant Ṁ but an increase of blackbody luminosity. In the Sco-like sources, LADC increases and the FB appears more similar to the NB (Fig. 7). In the Cyg-like sources, we proposed an additional energy source of unstable nuclear burning on the neutron star giving increased LBB at constant mass accretion rate. This was supported by good agreement of the mass accretion rate per unit area ṁ at the soft apex with the theoretical ṁST at the border of unstable/stable He burning in bright LMXB in a mixed H/He environment (e.g. Bildsten et al. 1998). For a source descending the NB, at the soft apex conditions in the neutron star atmosphere allow unstable burning and a flare begins. The Sco-like sources are clearly different with increases in both LADC and LBB. This suggests an increase of Ṁ on both NB and FB, while some other factor must be different in flaring and it is natural to think that this may be unstable burning. The increase of blackbody luminosity in flaring in the Sco-like sources is similar to that in GX 340+0 (Fig. 7) supporting this. In all Z-track sources there is an increase of blackbody radius in flaring (Fig. 5) suggestive of spreading of the burning region as might be expected across the neutron star in the Sco-like sources and possibly in an expanding atmosphere in the Cyg-like sources.
In GX 17+2, ṁ at the soft apex is close to ṁST (Fig. 9) so that unstable burning is expected in flaring. However, in Sco X-1 and GX 349+2 ṁ > ṁST implying that burning will be stable. A possible explanation is that with high radiation pressure at all times in these sources, the mass flow to the neutron star is modified by disruption of the inner disk, with mass permanently diverted out of the disk. ṁ is obtained from Ṁ assuming the standard relation with total luminosity, so that if mass is diverted away from the neutron star we over-estimate ṁ but ~80% of the flow would have to be diverted to bring ṁ into the unstable region.
4.2. A model for the Sco X-1 like sources
The results suggest a model for the Sco-like sources as follows. Ascending the NB the sources are similar to the Cyg-like sources with Ṁ increasing. Flaring is very different as Ṁ also increases suggesting that flaring is unstable nuclear burning combined with increasing Ṁ. The additional burning process causes the FB in hardness-intensity to deviate from the NB (becoming less hard). Variations of the mass accretion rate sometimes cause the source to move on the NB, but if unstable burning is triggered then the movement is on the FB. Unstable burning might be triggered if part of the mass flow has been diverted into the jet and away from the neutron star so that ṁ < ṁST. The radiation pressure is higher on the NB (Fig. 8) in the Sco-like sources so a source descending the NB may fulfil the unstable burning condition. Another possibility is that if only part of the neutron star is emitting at the soft apex, on the edge of the emitting region ṁ may be reduced and unstable burning possible. Galloway (2008) made a similar suggestion that accretion over a limited part of the star might at lower mass accretion rates produce X-ray bursts confined to part of the star, which might spread across the star (Bildsten 1995). The Cyg-like sources at the soft apex accrete over the whole star apparently so unstable burning only occurs when ṁ falls below the critical value. The Sco-like sources would be expected to move onto the NB from the soft apex after a period of flaring as further accumulation of matter would be needed for the next flare.
Secondly, the high temperature of the neutron star in Sco X-1 and GX 349+2 at all times > 2 keV results from the continual strong flaring releasing energy on the neutron star in contrast with the Cyg-like sources where flaring is rare and weak. Between flares, the neutron star could cool in principle by the emission of X-rays; however, it appears observationally that cooling is not effective on the timescale between flares as discussed below.
Thirdly, the model predicts that jets are formed when the radiation pressure is high. In the Cyg-like sources, this is in the region of the hard apex but not at the soft apex. However, in Sco X-1 the radiation pressure is high even at the soft apex and in flaring. The model thus predicts that radio emission in Cyg X-2 will sometimes be zero, i.e. quenched in flaring but emission in Sco X-1 may not become zero at the soft apex. In Cyg X-2 radio fluxes up to 5 mJy were found on the horizontal and upper normal branch at 1.49, 4.9 and 8.4 GHz but the source was not detected on the lower NB and FB with flux < 1 mJy, i.e. showing a clear correlation with Z-track position (Hjellming et al. 1990a). Similarly, Bałucińska-Church et al. (2011) found a 5σ upper limit of < 150 μJy at 5 GHz in e-EVN observations in 2009, May. Sco X-1 on the other hand has both radio-loud and radio-weak states and weak radio emission has been detected when on the FB (Hjellming et al. 1990b). This tends to support the prediction but clearly further testing is needed.
4.3. Cooling rate
We propose that unstable nuclear burning deposits energy in the neutron star such that, between flares, i.e. at the soft apex, the blackbody temperature measured for the atmosphere does not decrease but remains at 2 keV as in a flare. This may be compared with X-ray bursting in which the emission cools rapidly from ~2.2 keV to 1 keV between bursts. It thus appears that radiative losses are not effective in cooling the neutron star between flares. However, we found some evidence for a 10% cooling after 3 days without flares. This raises the interesting question of the rate of cooling of the neutron star.
In the case of X-ray burst sources, a small fraction of the nuclear energy released will flow into the interior at each burst, heating it. The time-averaged inward flow will be small: ~4% (Hanawa & Fujimoto 1984), because most of the energy released is radiated. In equilibrium, there will be an outward energy flow balancing this (Lamb & Lamb 1978; Ayasli & Joss 1982; Hanawa & Fujimoto 1984). Compressional heating and neutrino cooling will also be involved. The averaged inward flow is small, ≈ 1035 erg s-1, and the thermal capacity of the neutron star dominated by partially degenerate electrons is large, assuming the neutrons are super-fluid (Tsuruta et al. 1972) ≈ 3 × 1044 erg (Lamb & Lamb 1978). Thus the heating timescale can be ~100 years.
Unstable burning in flaring will also heat the star but whereas a burst lasts ~100 s and occupies only 1% of the interval between bursts, flaring is more prolonged at ~5000 s and the ratio of flare duration to flare spacing is higher. Thus the inward heat flow will be higher and so the heating timescale reduced, and in equilibrium, the outward flow of energy from the interior would also be increased.
To compare with our results, we consider what happens if the flaring is suddenly turned off after a long period of continuous flaring. If we assume an outward flow of heat much higher than in the burst source case, say 1037 erg s-1, for the whole neutron star to cool (i.e. the partially degenerate electrons) by 10% in temperature would require ≈ 0.1 year, about 10 times longer than the probable 3 days timescale. This may suggest that the appropriate cooling rate is not the equilibrium rate of outward heat flow, but a higher rate, for example, electrons in the crust may cool more rapidly than that.
4.4. The energetics of flaring
It may be thought that since nuclear burning, e.g. of hydrogen, is 30 times less efficient than accretion power, flaring cannot be nuclear in nature, and in the standard view of Z-track sources it is increasing Ṁ that powers flares in both Cyg and Sco-like sources. However, in the Cyg-like sources an increase of neutron star luminosity in flaring of 10 × 1037 erg s-1 for 2000 s say, releases a flare energy Eflare of ~ 1 × 1041 erg. Instantaneous nuclear burning of the accretion flow cannot supply this, but matter accumulating over a period of ≈ 3 h provides an energy ϵ M c2 ≥ Eflare. The flares in the Sco-like sources are stronger but only ~50% or less of the energy appears to be nuclear burning. LBB increases by ~20 × 1037 erg s-1 giving Eflare ~ 1 × 1041 erg which again can be provided by nuclear burning of accumulated matter.
This is completely analogous to nuclear burning in X-ray bursts in which it was realized at an early stage that although the energy release per nucleon is much less than the accretion release, if matter is accumulated and consumed suddenly, the nuclear burning temporarily dominated the energy release (Lamb & Lamb 1978).
4.5. Does luminosity determine Cyg-like or Sco-like nature?
The transient source XTE J1702-462 having an outburst in 2006–7 (Remillard et al. 2006) rose to high luminosity at the start of the outburst and exhibited Cyg-like properties, but as the brightness decreased became more similar to Sco-like sources and eventually displayed Atoll source properties (Homan et al. 2007; Lin et al. 2009). Homan et al. (2010) thus proposed that luminosity, i.e. mass accretion rate determined Cyg-like or Sco-like behaviour, higher Ṁ making the source Cyg-like. As pointed out by Homan et al., this also means that differences in inclination or magnetic field strength cannot determine the nature as previously suggested. The suggestion that luminosity determines Cyg or Sco-like behaviour is not supported by our results as we see no systematic differences of luminosity between the two types as shown in the figures, the Cyg-like sources spanning a factor of three in luminosity and the Sco-like sources almost as much. (It has been previously widely accepted, of course, that Cyg X-2 was less luminous than Sco X-1, for example).
It could be that distance errors lead to the apparent lack of dependence of source type on luminosity. For luminosity to determine type, all the Cyg-like sources would have to be more luminous than all the Sco-lke sources. In particular, Cygnus X-2 must be more luminous than Sco X-1 for which the distance is well-determined at 2.8 ± 0.3 kpc. The distance of Cyg X-2 assumed here to be 9.0 kpc (Table 6) would have to be > 14.7 kpc for the source to be as luminous as Sco X-1 (46 × 1037 erg s-1 at the soft apex).
Distances to Cyg X-2 were published by Cowley et al. (1979) of 5.7–8.7 kpc for assumed donor masses of 0.5–1.0 M⊙. Orosz & Kuulkers derived a donor mass of 0.6 ± 0.13 M⊙ and a distance of 7.2 ± 1.1 kpc. From peak burst fluxes, Smale (1998) found 11.6 ± 0.13 kpc and Galloway (2008) 11 ± 2 kpc for an H fraction X = 0.7 and 14 ± 3 for X = 0; however, not all bursts exhibited the characteristics of photospheric radius expansion, moreover bursting in the Z-track sources Cyg X-2 and GX 17+2 is not fully understood. Jonker & Nelemans (2004) give 11.4–15.3 kpc for hydrogen rich to helium rich material. Thus the distance is not well-constrained and Cyg X-2 could be as luminous as Sco X-1. However, to produce properties very different from Sco X-1 it would have to be appreciably more luminous needing a distance more than 20 kpc and this is unlikely.
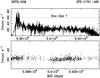 |
Fig. 13 ASM lightcurve of the transient XTE J1702-462: upper panel: the complete outburst; lower panel: expanded view showing the limited extent and occurrence of flaring. |
For GX 340+0, distances have been found of 10.2 kpc (Penninx 1989), 11.8 kpc (van Paradijs & White 1995) and 11.0 kpc (Grimm et al. 2002). L is 36.6 × 1037 erg s-1 at the soft apex for the assumed 11 kpc. This would need to be 12.3 kpc to be as luminous as Sco X-1 which is clearly possible, but ~17 kpc to be twice as luminous, say, which appears unlikely.
The identification of Sco-like behaviour in the transient was based on the shape of the Z-track. In the notation of Lin et al. (2009) the transient was Cyg-like in Sect. I of the lightcurve and Sco-like in Sects. II and III. The appearance of hardness-intensity in II was similar to GX 17+2 with a long NB; however, we suggest that this source is not fully Sco-like but transitional between the Cyg and Sco types. In III, the NB becomes small and the FB large and the source does appear Sco-like. However, the intensity increase in flaring was ≤ 40%in the total PCA band while all Sco-like sources have 100% increases or more (Figs. 2 and 10), and Cyg X-2 sometimes displays flares of up to 50%, so the flaring is not conclusive. In several respects, Homan et al. (2007) also did not find XTE J1702-462 unambiguously Sco-like.
Towards resolving whether the transient source was truly Sco-like, in Fig. 13 the ASM lightcurve of the transient source is shown for comparison with the lightcurves of Sco X-1 and GX 349+2 (Fig. 10). The upper panel shows the complete brightening and decay of the transient; the dotted line shows the part which was thought to be similar to the Sco-like sources; a known modulation at 25 days (Homan et al. 2007) can be seen. In the lower panel, a restricted part of the lightcurve is shown so that the extent of flaring can be seen without this modulation. It is evident that the flaring is not continuous or strong as in Sco X-1 but sparse and weak suggesting that the source was not Sco-like.
Rather than making identification on the appearance of the Z-track, based on the present work we can offer a physical definition of Sco-like nature: that the neutron star blackbody temperature kTBB is at all times >2 keV, and that there is frequent strong flaring. Thus GX 17+2 is not fully Sco-like but transitional between Cyg and Sco-like. We suggest that XTE J1702-462 may not have been Sco-like as it decayed but remained Cyg-like with stronger flaring; this is sometimes but not often seen in Cyg X-2. On the basis that the source would move closer to the condition for unstable burning (ṁ < ṁST) as luminosity decreased, this would be expected. Whether the transient source satisfied the above definition for being Sco-like, or not, could be checked by spectral analysis. If the source did not become Sco-like, then luminosity may not determine whether sources are Cyg-like or Sco-like.
4.6. A general Z-track model
Application of the extended ADC model having the form discussed in Sect. 1.4 has provided a physical model for the Z-track sources. In summary, in all types of Z-track source, ascending the normal branch is due to an increase of Ṁ for which spectral fitting presents convincing evidence, as a definite increase of both total X-ray luminosity LTot and ADC luminosity LADC. The resultant high neutron star temperature gives a high radiation pressure launching the jets. In Cyg X-2 this predicts an intermittent jet when the source is on that part of the Z. In Sco X-1 the jet may be present even at the soft apex due to the permanently high kTBB.
Flaring in the Cyg-like sources consists of unstable nuclear burning. In the Sco-like sources, Ṁ increases as the source moves away from the soft apex on the NB or FB. Sometimes conditions favour unstable burning so making the FB distinct from the NB. Strong flaring in the Sco-like sources causes the observed spectral differences, i.e. high neutron star temperature and associated radiation pressure. The permanently high kTBB and high radiation pressure may suggest a permanent bending of the accretion flow out of the plane into the jet. The residual flow to the neutron star may then satisfy the condition for unstable burning (ṁ < ṁST) so that a period of matter accumulation is followed by flaring, this then repeating. In the Cyg-like sources there is no permanent bending of the accretion flow, so unstable burning only takes place when Ṁ is low. The relevant question then becomes what is the fundamental cause of the strong flaring in the Sco-like sources.
As discussed in Sect. 4.5, the present results do not confirm that Cyg or Sco-like nature is determined by luminosity as suggested by Lin et al. (2009). In this case, some other factor is responsible. Flaring in the Cyg-like sources will only take place when a decrease of Ṁ causes ṁ to fall below the critical value, and this makes flaring weak and infrequent. The fully Sco-like sources (excepting GX 17+2) are clearly different with longterm diversion of accretion flow into jets implied. It is possible that this could be connected with the long orbital periods of 18.9 and 21.85 h in Sco X-1 and GX 349+2 as this suggests evolved companions and higher mass accretion rates. This could heat the neutron star causing jet launching and conditions for unstable burning may become more often satisfied.
Online material
GX 349+2 spectral fitting results.
Sco X-1 with strong flaring.
Sco X-1 with reduced flaring.
References
- Ayasli, S., & Joss, P. C. 1982, ApJ, 256, 637 [NASA ADS] [CrossRef] [Google Scholar]
- Bałucińska-Church, M., Church, M. J., Oosterbroek, T., et al. 1999, A&A, 349, 495 [NASA ADS] [Google Scholar]
- Bałucińska-Church, M., Humphrey, P. J., Church, M. J., & Parmar, A. N. 2000, A&A, 360, 583 [NASA ADS] [Google Scholar]
- Bałucińska-Church, M., Barnard, R., Church, M. J., & Smale, A. P. 2001, A&A, 378, 847 [NASA ADS] [CrossRef] [EDP Sciences] [Google Scholar]
- Bałucińska-Church, M., Gibiec, A., Jackson, N. K., & Church, M. J. 2010, A&A, 512, A9 (Paper III) [NASA ADS] [CrossRef] [EDP Sciences] [Google Scholar]
- Bałucińska-Church, M., Schulz, N. S., Wilms, J., et al. 2011, A&A, 530, A102 [NASA ADS] [CrossRef] [EDP Sciences] [Google Scholar]
- Bałucińska-Church, M., Church, M. J., & Gibiec, A. 2012, Mem. S. A. It., in press [Google Scholar]
- Barnard, R., Bałucińska-Church, M., Smale, A. P., & Church, M. J. 2001, A&A, 380, 494 [NASA ADS] [CrossRef] [EDP Sciences] [Google Scholar]
- Barnard, R., Church, M. J., & Bałucińska-Church, M. 2003, A&A, 405, 237 [NASA ADS] [CrossRef] [EDP Sciences] [Google Scholar]
- Bildsten, L. 1995, ApJ, 438, 852 [NASA ADS] [CrossRef] [Google Scholar]
- Bildsten, L. 1998, in Proc. NATO ASIC 515, The Many Faces of Neutron Stars, eds. R. Buccheri, J. van Paradijs & M. A. Alpar (Dordrecht-Kluwer), 419 [Google Scholar]
- Bradshaw, C. F., Fomalont, E. B., & Geldzahler, B. J. 1999, ApJ, 512, L121 [NASA ADS] [CrossRef] [Google Scholar]
- Bradshaw, C. F., Geldzahler, B. J., & Fomalont, E. B. 2003, ApJ, 592, 486 [NASA ADS] [CrossRef] [Google Scholar]
- Callanan, P. J., Curran, P., Filippenko, A. V., et al. 2002, ApJ, 574, L143 [NASA ADS] [CrossRef] [Google Scholar]
- Canizares, C. R., Clark, G. W., Li, F. K., et al. 1975, ApJ, 197, 457 [NASA ADS] [CrossRef] [Google Scholar]
- Casella, P., Belloni, T., & Stella, L. 2006, A&A, 446, 579 [NASA ADS] [CrossRef] [EDP Sciences] [Google Scholar]
- Church, M. J., & Bałucińska-Church, M. 2001, A&A, 369, 915 [NASA ADS] [CrossRef] [EDP Sciences] [Google Scholar]
- Church, M. J., & Bałucińska-Church, M. 2004, MNRAS, 348, 955 [NASA ADS] [CrossRef] [Google Scholar]
- Church, M. J., Mitsuda, K., Dotani, T., et al. 1997, ApJ, 491, 388 [NASA ADS] [CrossRef] [Google Scholar]
- Church, M. J., Bałucińska-Church, M., Dotani, T., & Asai, K. 1998a, ApJ, 504, 516 [NASA ADS] [CrossRef] [Google Scholar]
- Church, M. J., Parmar, A. N., Bałucińska-Church, M., et al. 1998b, A&A, 338, 556 [NASA ADS] [Google Scholar]
- Church, M. J., Inogamov, N. A., & Bałucińska-Church, M. 2002, A&A, 390, 139 [NASA ADS] [CrossRef] [EDP Sciences] [Google Scholar]
- Church, M. J., Reed, D., Dotani, T., Bałucińska-Church, M., & Smale, A. P. 2005, 359, 1336 [Google Scholar]
- Church, M. J., Halai, G. S., & Bałucińska-Church, M. 2006, A&A, 460, 233 (Paper I) [NASA ADS] [CrossRef] [EDP Sciences] [Google Scholar]
- Church, M. J., Dimbylow, O., Peach, C., & Bałucińska-Church, M. 2010, MemSAIt, 81, 275 [NASA ADS] [Google Scholar]
- Christian, D. J., & Swank, J. H. 1997, ApJS, 109, 177 [NASA ADS] [CrossRef] [Google Scholar]
- Cowley, A. P., & Crampton, D. 1975, ApJ, 201, L65 [NASA ADS] [CrossRef] [Google Scholar]
- Cowley, A. P., Crampton, D., & Hutchings, J. B. 1979, ApJ, 231, 539 [NASA ADS] [CrossRef] [Google Scholar]
- Dickey, J. M., & Lockman, F. J. 1990, ARA&A, 28, 215 [NASA ADS] [CrossRef] [MathSciNet] [Google Scholar]
- di Salvo, T., Robba, N. R., Iaria, R., et al. 2001, ApJ, 554, 49 [NASA ADS] [CrossRef] [Google Scholar]
- Dieters, S., & van der Klis, M. 2000, MNRAS, 311, 201 [NASA ADS] [CrossRef] [Google Scholar]
- Ebisuzaki, T., Hanawa, T., & Sugimoto, D. 1984, PASJ, 36, 551 [NASA ADS] [Google Scholar]
- Fujimoto, M. Y., Hanawa, T., & Miyaji, S. 1981, ApJ, 247, 267 [NASA ADS] [CrossRef] [Google Scholar]
- Fushiki, I., & Lamb, D. Q. 1987, ApJ, 323, L55 [NASA ADS] [CrossRef] [Google Scholar]
- Fomalont, E. B., Geldzahler, B. J., & Bradshaw, C. F. 2001, ApJ, 558, 283 [NASA ADS] [CrossRef] [Google Scholar]
- Giacconi, R., Gursky, H., Paolini, F., & Rossi, B. 1962, Phys. Rev. Lett., 9, 439 [NASA ADS] [CrossRef] [Google Scholar]
- Grimm, H. J., Gilfanov, M., & Sunyaev, R. 2002, A&A, 391, 923 [NASA ADS] [CrossRef] [EDP Sciences] [Google Scholar]
- Hanawa, T., & Fujimoto, M. Y. 1984, PASJ, 36, 199 [NASA ADS] [Google Scholar]
- Hansen, C. J., & van Horn, H. M. 1975, APJ, 195, 735 [Google Scholar]
- Hasinger, G., & van der Klis, M. 1989, A&A, 225, 79 [NASA ADS] [Google Scholar]
- Hasinger, G., Priedhorsky, W. C., & Middleditch, J. 1989, ApJ, 337, 843 [NASA ADS] [CrossRef] [Google Scholar]
- Hasinger, G., van der Klis, M., Ebisawa, K., Dotani, T., & Mitsuda, K. 1990, A&A, 235, 131 [NASA ADS] [Google Scholar]
- Hertz, P., Vaughan, B., Wood, K. S., et al. 1992, ApJ, 396, 201 [NASA ADS] [CrossRef] [Google Scholar]
- Hjellming, R. M., Han, X. H., Córdova, F. A., & Hasinger, G. 1990a, A&A, 235, 147 [NASA ADS] [Google Scholar]
- Hjellming, R. M., Stewart, R. T., & White, G. L. 1990b, ApJ, 365, 681 [Google Scholar]
- Homan, J., van der Klis, M., Jonker, P. G., et al. 2002, ApJ, 568, 878 [NASA ADS] [CrossRef] [Google Scholar]
- Homan, J., van der Klis, M., Wijnands, R., et al. 2007, ApJ, 656, 420 [NASA ADS] [CrossRef] [Google Scholar]
- Homan, J., van der Klis, M., Fridriksson, J. K., et al. 2010, ApJ, 719, 201 [NASA ADS] [CrossRef] [Google Scholar]
- Iaria, R., Di Salvo, T., Robba, N. R., et al. 2004, ApJ, 600, 358 [NASA ADS] [CrossRef] [Google Scholar]
- Inogamov, N. A., & Sunyaev, R. A. 1999, AstL, 25, 269 [Google Scholar]
- Jackson, N. K., Church, M. J., & Bałucińska-Church, M. 2009, A&A, 494, 1059 (Paper II) [NASA ADS] [CrossRef] [EDP Sciences] [Google Scholar]
- Jahoda, K., Swank, J. H., Giles, A. B., et al. 1996, SPIE, 2808, 59 [Google Scholar]
- Jimenez-Garate, M. A., Raymond, J. C., & Liedahl, D. A. 2002, ApJ, 581, 1297 [NASA ADS] [CrossRef] [Google Scholar]
- Kahn, S. M., & Grindlay, J. E. 1984, ApJ, 281, 826 [NASA ADS] [CrossRef] [Google Scholar]
- Kalberla, P. M. W., Burton, W. B., & Hartmann, D. 2005, A&A, 440, 775 [NASA ADS] [CrossRef] [EDP Sciences] [Google Scholar]
- Kuulkers, E., van der Klis, M., Oosterbroek, T., van Paradijs, J., & Lewin, W. H. G. 1997, A&A, 287, 495 [Google Scholar]
- Kuulkers, E., Homan, J., van der Klis, M., Lewin, W. H. G., & Méndez, M. 2002, A&A, 382, 947 [NASA ADS] [CrossRef] [EDP Sciences] [Google Scholar]
- Lamb, D. Q., & Lamb, F. K. 1978, ApJ, 220, 291 [NASA ADS] [CrossRef] [Google Scholar]
- Langmeier, A., Hasinger, G., & Trümper, J. 1990, A&A, 228, 89 [NASA ADS] [Google Scholar]
- Lin, D., Remillard, R. A., & Homan, J. 2009, ApJ, 696, 1257 [NASA ADS] [CrossRef] [Google Scholar]
- Migliari, S., Miller-Jones, J. C. A., Fender, R. P., et al. 2007, ApJ, 671, 706 [NASA ADS] [CrossRef] [Google Scholar]
- Mitsuda, K., Inoue, H., Nakamura, N., & Tanaka, Y. 1989, PASJ, 41, 97 [NASA ADS] [Google Scholar]
- Penninx, W. 1989, in Proceedings of the 23rd ESLAB symposium on Two Topics in X-ray Astronomy, eds. J. Hunt, & B. Battrick, ESA SP-296, 185 [Google Scholar]
- Priedhorsky, W., Hasinger, G., Lewin, W. H. G., et al. 1986, ApJ, 306, L91 [NASA ADS] [CrossRef] [Google Scholar]
- Remillard, R. A., Lin, D., et al. 2006, ATel, 696 [Google Scholar]
- Schatz, H., Bildsten, L., Cumming, A., & Wiescher, M. 1999, ApJ, 524, 1014 [NASA ADS] [CrossRef] [Google Scholar]
- Shapiro, S. L., Lightman, A. P., & Eardley, D. M. 1976, ApJ, 204, 187 [NASA ADS] [CrossRef] [Google Scholar]
- Schulz, N. S., Hasinger, G., & Trümper, J. 1989, A&A, 225, 48 [NASA ADS] [Google Scholar]
- Schulz, N. S., Huenemoerder, D. P., Ji, L., et al. 2009, ApJ, 692, L80 [NASA ADS] [CrossRef] [Google Scholar]
- Smale, A. P., Church, M. J., & Bałucińska-Church, M. 2001, ApJ, 550, 962 [NASA ADS] [CrossRef] [Google Scholar]
- Steeghs, D., & Casares, J. 2002, ApJ, 568, 273 [NASA ADS] [CrossRef] [Google Scholar]
- Suleimanov, V., Poutanen, J., & Werner, K. 2011, A&A, 527, A139 [NASA ADS] [CrossRef] [EDP Sciences] [Google Scholar]
- Sztajno, M., van Paradijs, J., Lewin, W. H. G., Langmeier, A., & Trümper, J. 1986, MNRAS, 222, 499 [NASA ADS] [CrossRef] [Google Scholar]
- Tawara, Y., Hirano, T., & Kii, T. 1984, PASJ, 36, 861 [NASA ADS] [Google Scholar]
- Tsuruta, S., Canuto, V., Lodenquai, J., & Ruderman, M. 1972, ApJ, 176 739 [Google Scholar]
- van der Klis, M. 2003, in Compact Stellar X-ray sources, eds. W. H. G. Lewin, & M. van der Klis (Cambridge University Press) [Google Scholar]
- van der Klis, M., Stella, L., White, N. E., Jansen, F., & Parmar, A. N. 1987, ApJ, 316, 411 [NASA ADS] [CrossRef] [Google Scholar]
- van der Klis, M., Swank, J. H., Zhang, W., et al. 1996, ApJ, 469, L1 [NASA ADS] [CrossRef] [Google Scholar]
- van Paradijs, J., & White, N. E. 1995, ApJ, 447, L33 [NASA ADS] [CrossRef] [Google Scholar]
- Vrtilek, S. D., Raymond, J. C., Garcia, M. R., et al. 1990, A&A, 235, 162 [NASA ADS] [Google Scholar]
- Wachter, S., & Margon, B. 1996, AJ, 112, 2684 [NASA ADS] [CrossRef] [Google Scholar]
- White, N. E., & Swank, J. H. 1982, ApJ, 253, L66 [Google Scholar]
- White, N. E., Peacock, A., & Taylor, B. G. 1985, ApJ, 296, 475 [NASA ADS] [CrossRef] [Google Scholar]
- Wijnands, R., van der Klis, M., Psaltis, D., et al. 1996, ApJ, 469, L5 [NASA ADS] [CrossRef] [Google Scholar]
- Wijnands, R., Homan, J., van der Klis, M., et al. 1997, ApJ, 490, L157 [NASA ADS] [CrossRef] [Google Scholar]
- Wijnands, R., Mendez, M., van der Klis, M., et al. 1998, ApJ, 504, L35 [NASA ADS] [CrossRef] [Google Scholar]
- Zhang, W., Strohmayer, T. E., & Swank, J. E. 1998, ApJ, 500, L167 [NASA ADS] [CrossRef] [Google Scholar]
All Tables
All Figures
|
Fig. 1 Lightcurves from the Rossi-XTE PCA, background-subtracted and deadtime-corrected of the 3 sources with 64 s binning. Upper panel: GX 349+2; upper middle panel: typical Sco X-1 data with strong flaring; lower middle panel: Sco X-1 in an exceptionally flare-free state; lower panel: GX 17+2; the gaps between the 4 sub-observations are removed for clarity. |
| In the text | |
|
Fig. 2 Z-track of the observation derived from background subtracted and deadtime corrected lightcurves with 64 s binning. The boxes show the ranges of intensity and hardness ratio used for the selection of PCA and HEXTE spectra. |
| In the text | |
|
Fig. 3 Best fit spectra for GX 17+2 in the NB (top; spectrum n2) and FB (bottom; spectrum f5), showing the folded data (left) with residuals and unfolded data (right). The error bars are generally too small to be visible. Model components are labelled in the unfolded spectra. |
| In the text | |
|
Fig. 4 The neutron star blackbody emission in the Sco-like sources: GX 17+2: green filled squares, GX 349+2: red open circles, Sco X-1: red filled circles. Upper panel: the blackbody temperature; lower panel: the blackbody radius. Results are shown only for the observation of Sco X-1 in its normal state with strong flaring (obsid P30036). The branches are labelled H (horizontal), N (normal) and F (flaring). In the electronic version of the paper, sources are shown with individual colours. |
| In the text | |
|
Fig. 5 Comparison of the Sco X-1 like sources with the Cyg X-2like sources. In all figures the Cyg-like sources will be shown as blue filled circles; GX 349+2 will have red open circles and Sco X-1 red filled circles. The nominally Sco-like source GX 17+2 will be shown with green filled squares to emphasize its transitional nature with some characteristics Cyg-like and some Sco-like. To help distinguish between the sub-groups of sources, Sco-like sources have branch labels: H, N and F while Cyg-like sources use h, n and f. |
| In the text | |
|
Fig. 6 Variation of the blackbody luminosity (upper panel) and ADC luminosity (lower panel) around the Z-track in the Sco-like sources. To improve clarity, an expanded view of GX 17+2 is given in the inset. |
| In the text | |
|
Fig. 7 Comparison of the Sco X-1 like sources with the Cyg X-2 like sources. |
| In the text | |
|
Fig. 8 The emissive flux f of unit area of the neutron star as a fraction of the Eddington flux fEdd for the Sco X-1 like sources compared with the Cyg X-2 like sources. |
| In the text | |
|
Fig. 9 Values of the measured mass accretion rate per unit area to the neutron star compared with the theoretical critical value ṁST demarcating regimes of unstable and stable burning (Bildsten 1998) shown as a dashed line. The dotted lines show the 30% uncertainty attached to the theoretical value. |
| In the text | |
|
Fig. 10 Comparison of flaring in the Sco-like and Cyg-like sources using 15 years of RXTE All SKy Monitor data. The peaks in the Cyg X-2 lightcurve are due to source variability, not flaring (see text). |
| In the text | |
|
Fig. 11 Comparison of blackbody temperature and radius for the two observations of Sco X-1, one having strong flaring as normal, and the other during reduced flaring. |
| In the text | |
|
Fig. 12 The major difference between the Sco X-1 like and Cyg X-2 like sources at the soft apex; upper panel: the blackbody temperature kTBB; lower panel: the corresponding blackbody radii RBB. The dotted lines correspond to the upper and lower limits of the average RBB for the three Cyg-like sources of 11.6 ± 0.6 km at 90% confidence. |
| In the text | |
|
Fig. 13 ASM lightcurve of the transient XTE J1702-462: upper panel: the complete outburst; lower panel: expanded view showing the limited extent and occurrence of flaring. |
| In the text | |
Current usage metrics show cumulative count of Article Views (full-text article views including HTML views, PDF and ePub downloads, according to the available data) and Abstracts Views on Vision4Press platform.
Data correspond to usage on the plateform after 2015. The current usage metrics is available 48-96 hours after online publication and is updated daily on week days.
Initial download of the metrics may take a while.