Free Access
Fig. 3

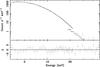
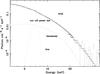
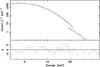
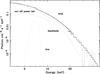
Best fit spectra for GX 17+2 in the NB (top; spectrum n2) and FB (bottom; spectrum f5), showing the folded data (left) with residuals and unfolded data (right). The error bars are generally too small to be visible. Model components are labelled in the unfolded spectra.
This figure is made of several images, please see below:
Current usage metrics show cumulative count of Article Views (full-text article views including HTML views, PDF and ePub downloads, according to the available data) and Abstracts Views on Vision4Press platform.
Data correspond to usage on the plateform after 2015. The current usage metrics is available 48-96 hours after online publication and is updated daily on week days.
Initial download of the metrics may take a while.