Fig. 5
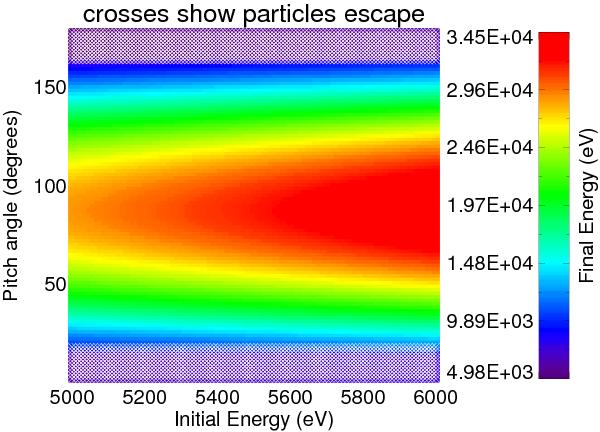
Final energy (colour contours) of test particles with the same initial position (x = 0.1 L, y = 2.0 L), but different initial energies (y-axis) and pitch angles (x-axis). Crossed squares indicate particles that escape before the trap has collapsed. For this initial position the highest energy particles have pitch angles closest to 90°.
Current usage metrics show cumulative count of Article Views (full-text article views including HTML views, PDF and ePub downloads, according to the available data) and Abstracts Views on Vision4Press platform.
Data correspond to usage on the plateform after 2015. The current usage metrics is available 48-96 hours after online publication and is updated daily on week days.
Initial download of the metrics may take a while.