Free Access
Fig. 12

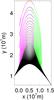
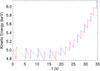
Final energy vs. pitch angle for different starting positions in the asymmetric trap. All particles start with energy 5.5 keV. The region shown is centred on the maximum energy gain. The spacing is differnt to Fig. 6. Red shows particles that escape before the trap has collapsed.
This figure is made of several images, please see below:
Current usage metrics show cumulative count of Article Views (full-text article views including HTML views, PDF and ePub downloads, according to the available data) and Abstracts Views on Vision4Press platform.
Data correspond to usage on the plateform after 2015. The current usage metrics is available 48-96 hours after online publication and is updated daily on week days.
Initial download of the metrics may take a while.