Fig. 5
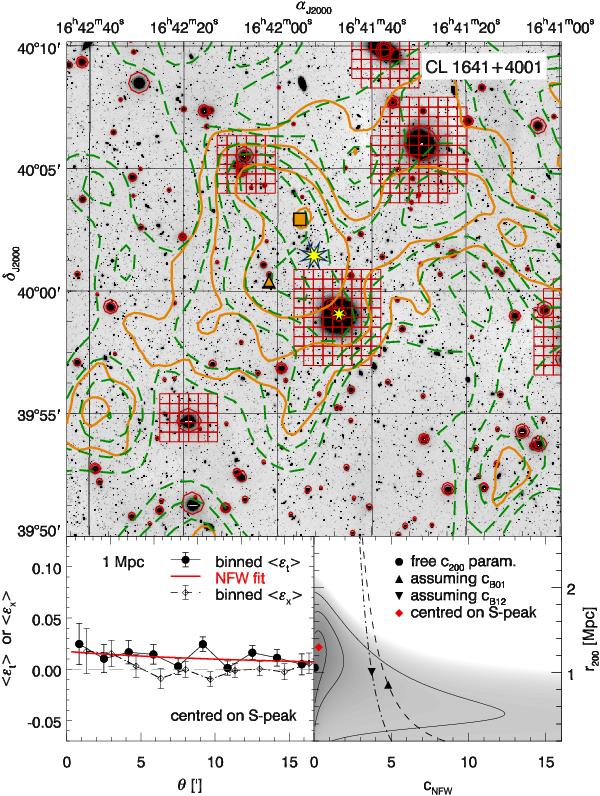
Same as Fig. 2, but for CL 1641+4001. In the map, a triangle denotes the secondary shear peak, while a small star symbol marks the position of the von der Linden et al. (2007) cluster candidate. Note that no peak in the complex pattern of shear peaks correlates with its position.
Current usage metrics show cumulative count of Article Views (full-text article views including HTML views, PDF and ePub downloads, according to the available data) and Abstracts Views on Vision4Press platform.
Data correspond to usage on the plateform after 2015. The current usage metrics is available 48-96 hours after online publication and is updated daily on week days.
Initial download of the metrics may take a while.