| Issue |
A&A
Volume 546, October 2012
|
|
|---|---|---|
| Article Number | A79 | |
| Number of page(s) | 31 | |
| Section | Cosmology (including clusters of galaxies) | |
| DOI | https://doi.org/10.1051/0004-6361/201118676 | |
| Published online | 10 October 2012 | |
Online material
Appendix A: Photometric calibration details
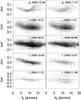 |
Fig. A.1
Accuracy of the photometric calibration: For the different combinations of filters and nights used to calibrate the data sets discussed in this work and Paper I, the scatter Δm′ around the best-fit solution (solid line) is shown. Each point corresponds to an SDSS standard source for which the abscissae give the separation θ0 in arc minutes from the centre of the pointing. Note that for each panel a maximum Δm′ has been determined by iterative 3σ-clipping. |
| Open with DEXTER | |
Applying the Hildebrandt et al. (2006) method,
photometric calibration of our data is established by fitting instrumental
(minst) to reference (mSDSS)
magnitudes for a sample of objects, taking into account variable airmass
a and a colour term cSDSS describing the
transformation between MegaCam and SDSS filter systems:  (A.1)Depending on
the photometric quality of the observations, we fit the zeropoint
Zf together with the parameters
βf or γf in optimal
conditions, or keep γf fixed at the default value depending
on the filter f for poorer conditions.
(A.1)Depending on
the photometric quality of the observations, we fit the zeropoint
Zf together with the parameters
βf or γf in optimal
conditions, or keep γf fixed at the default value depending
on the filter f for poorer conditions.
The resulting values for the fit parameters, as well as the colour indices cSDSS,f for the different filters are presented in Table A.1, for all photometric nights of our MegaCam runs11. We find the zeropoints Zf of the photometric nights to agree among the g′r′i′ filters, with a largest deviation of ≈0.15 mag. The scatter Δm′ = minst − mSDSS + βfcSDSS,f + γfa + Zf of the individual SDSS standards about the best-fit solution (Fig. A.1) has a comparable amplitude. The errors of Zf given in Table A.1 are the formal fitting errors. Figure A.1 presents the data from which the fit parameters have been determined, applying an iterative 3σ-clipping fit of Eq. (A.1).
Comparing the colour terms βf for the different nights, we find considerable agreement within the values for each of the three bands, although the formal errors underestimate the true uncertainties. We suggest that the large span in values of βg might be caused by the known dependence of the filter throughput on the distance to the optical axis. Plotting the scatter Δm′ as a function of the separation θ0 of the source from the optical axis of MegaCam (Fig. A.1), given by the pointing position in the fits header, we can confirm trends of Δm′(θ0) in all filters, most pronounced for the g′ band data taken on 2005 October 30. This trend is likely caused by a combination of the sky concentration effect (position-dependent illumination due to scattering in the telescope optics) and the position-dependent transmissivity of the MegaCam filters, which is strongest in the g′ band (cf. Fig. A.3 in Paper I). A more conclusive investigation of this issue, requiring full propagation of errors on instrumental magnitude, lies beyond the scope of this paper. Because the radial dependence observed in Fig. A.1 does not exceed the residual scatter for sources at the same θ0, the global photometric fits (Eq. (A.1)) fulfil the requirements of our analysis.
Appendix B: Details of background selection
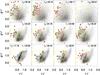 |
Fig. B.1
Fraction of zph ≤ 0.40 galaxies in the Deep 1 (Ilbert et al. 2006) field as a function of
their g′ − r′ and
r′ − i′ colours and
r′ magnitude. Each panel shows a dodecile of the
photo-z catalogue, i.e. one of twelve equally populated
magnitude bins, where the k-th dodecile includes all
galaxies |
| Open with DEXTER | |

In the intermediate magnitude range mbright ≤ r′ ≤ mfaint, our lensing catalogues for three-band clusters include galaxies selected from g′ − r′ versus r′ − i′ colour–colour- diagrams (Sect. 2.4). We find our method justified by considering the Ilbert et al. (2006) photo-z catalogue:
Figure B.1 presents the galaxy numbers and the
fraction of zph ≤ 0.50 sources in the Deep 1
photo-z catalogue as a function of the r′
magnitude and g′ − r′ and
r′ − i′ colours. First, the
catalogue is divided into its dodeciles in r′, i.e. twelve
magnitude bins of equal population are defined where the k-th bin
consists of the galaxies  .
By
.
By  , we denote
the magnitude of a source such there is a fraction
of k/12 of brighter galaxies in the catalogue.
Second, for each dodecile, we show the
number Nij of galaxies falling into grid
cells of mesh
size Δ(g′ − r′) = Δ(r′ − i′) = 0.1,
using a grey scale. Figure B.1 highlights that at
bright r′, only a narrow strip in the colour–colour space
spanned by g′ − r′
and r′ − i′ is populated,
while the locus of galaxies becomes much more diffuse towards fainter
r′. Third, for each grid cell, we determine the fraction
of galaxies we define as foreground sources, i.e. the sources with a redshift estimate
zph ≤ 0.40. The red, green, and blue contours in
Fig. B.1 mark regions of the colour–colour space
populated by 25%, 50%, and 75% of foreground galaxies compared to
the zd = 0.40 clusters, CL 0159+0030 and CL 0809+2811. The
contours are defined such that ffg exceeds the respective
threshold in all grid cells enclosed by the contour.
, we denote
the magnitude of a source such there is a fraction
of k/12 of brighter galaxies in the catalogue.
Second, for each dodecile, we show the
number Nij of galaxies falling into grid
cells of mesh
size Δ(g′ − r′) = Δ(r′ − i′) = 0.1,
using a grey scale. Figure B.1 highlights that at
bright r′, only a narrow strip in the colour–colour space
spanned by g′ − r′
and r′ − i′ is populated,
while the locus of galaxies becomes much more diffuse towards fainter
r′. Third, for each grid cell, we determine the fraction
of galaxies we define as foreground sources, i.e. the sources with a redshift estimate
zph ≤ 0.40. The red, green, and blue contours in
Fig. B.1 mark regions of the colour–colour space
populated by 25%, 50%, and 75% of foreground galaxies compared to
the zd = 0.40 clusters, CL 0159+0030 and CL 0809+2811. The
contours are defined such that ffg exceeds the respective
threshold in all grid cells enclosed by the contour.
As expected, ffg generally decreases towards fainter magnitudes, with only a few zph ≤ 0.40 sources at r′ > 26.0. For all magnitudes, foreground sources with r′ − i′ > 0.5 are rare. In the brightest three dodeciles, a well-defined region with a distinctive edge towards redder r′ − i′ colours exists12 Although the preferred locus of zph ≤ 0.40 galaxies depends little on the r′ magnitude, the zone populated by low-z objects becomes more diffuse for fainter sources. The insignificant role of foreground galaxies r′ > 25.0 justifies that our background selection includes all galaxies fainter than mfaint. Furthermore, the secondary role of mbright compared to mfaint becomes clear from Fig. B.1, noticing the small number of r′ < 20 galaxies.
Calculating ffg for a cluster redshift of
zd = 0.80, the regions in colour–colour space where a
given value of ffg is exceeded extend as well towards
fainter r′ as towards
redder g′ − r′
and r′ − i′ colours.
For zd = 0.80, only a small number of background sources
remain in the first dodecile, while there are significant foreground objects even in
the  bin.
bin.
We adjust our background selection polygon to zd = 0.40 and zd = 0.80 by defining criteria based on ffg > 0.25 contours in the three brightest dodeciles (r′ < 23.91) of the Deep 1 photo-z catalogue (Table B.1 and yellow polygon in Fig. B.1). We exclude galaxies at mbright ≤ r′ ≤ mfaint and matching these criteria from the lensing catalogues. Performing a cross-check for zd = 0.50, we confirm the background selection in Paper I to be sensible, although not optimal. In fact, more “self-calibrations” can be achieved by combining three-colour photometry with photo-z catalogues (Klein et al., in prep.).
Appendix C: Details of photo-z analysis
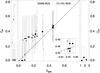 |
Fig. C.1
CFHT photometric redshifts plotted against spectroscopic redshifts from SDSS. The left panel (star symbols) shows the zph for objects identified as stars in SDSS, the middle panel (filled circles) for normal galaxies, and the right panel (filled squares) for QSOs. A small inlay gives a zoomed version for zspec ≈ 0.45 galaxies. The size of the symbols marking the photo-z estimate correspond to the quality parameter o (ODDS): big symbols for o > 0.9, medium-sized symbols for 0.8 < o < 0.9, and small symbols for 0.7 < o < 0.8. Error bars for the zph give the uncertainty interval defined by the BPZ Z_B_MIN and Z_B_MAX parameters. Objects inside a flagged region of one of the CFHT images (CANDMASK = 1) are shown in grey. |
| Open with DEXTER | |
C.1. Spectroscopic calibration
Because our photo-z catalogue for the CFHT CL 1701+6414 field was distilled from only four bands, three of which have rather shallow exposure time (Table 5), we tested its quality by comparison with publicly available SDSS spectroscopy redshifts of the same field. SDSS spectra are only available for a selection of the brightest (r′ ≲ 19) sources, with a total of 88 matches for the ≈270 000 object photo-z catalogue. Out of the 58 sources flagged as good by BPZ in all four filters, 45 are identified as normal galaxies by SDSS, nine are identified as stars, and four as QSOs. Figure C.1 displays zph as a function of zspec of the matched sources for which the BPZ quality parameter ODDS is o > 0.7. The size of the symbols in Fig. C.1 (star symbols for stars, filled circles for normal galaxies, and filled squares for QSOs) corresponds to the value of o.
Generally, the photo-z uncertainties (given by the BPZ Z_B_MIN and Z_B_MAX parameters) are large, although the sources in Fig. C.1 rank among the brightest in the catalogue. Nevertheless, the zph estimates for normal galaxies seem to follow a remarkably narrow and monotonic function of zspec, in the range 0 < zspec ≲ 0.45 probed by the SDSS spectral targets in Fig. C.1. The step at zspec ≈ 0.10, below which galaxies get assigned zph ≈ 0.0 and above which they are overestimated to be at zph ≈ 0.3, can be explained by the lack of a u′ filter crucial for detecting the 400 nm break at these redshifts. In particular, this applies to galaxies in the z ≈ 0.22 structures in the foreground to CL 1701+6414, as exemplified by the zph ≈ 0.40 for one of the A 2246 BCG candidates at zspec ≈ 0.235.
Photo-z estimates for the highest redshift (z ≈ 0.45) galaxies with SDSS spectra are stunningly accurate, despite the large uncertainties. The overall trend seen in Fig. C.1 is consistent with the results of the CFHTLS-Archive-Research Survey (Erben et al. 2009). In their analoguous comparison of CFHT BPZ photo-zs to SDSS spectra, they find a turnover to zph < zspec for zspec ≳ 0.45 (for a small absolute number of such galaxies).
It is a lucky coincidence that the
zph-zspec-relation
intersects the dotted equality line precisely at the redshift of our cluster of
interest. There are six galaxies
0.448 < zspec < 0.457 among
the SDSS spectral targets (inlay in Fig. C.1),
while there are none in the
0.36 < zspec < 0.44
range. These six include the BCG of CL 1701+6414
at zspec = 0.4523 ± 0.0001, for which BPZ
returns zph = 0.45 ± 0.19. However, even the closest of
the other five is separated by  or 4.0 Mpc in projection
and thus not part of or closely interacting with CL 1701+6414. Still,
its zspec = 0.4522 ± 0.0001 indicates they might belong
to the same large-scale structure.
or 4.0 Mpc in projection
and thus not part of or closely interacting with CL 1701+6414. Still,
its zspec = 0.4522 ± 0.0001 indicates they might belong
to the same large-scale structure.
The photo-z estimates for QSOs (right panel of Fig. C.1) are clearly off, which doesn’t come as a surprise as their is no QSO spectrum among the templates employed by BPZ. Although five out of eight stars in Fig. C.1 (left panel) get assigned zph ≤ 0.02, there are also three cases in which our photo-z catalogue suggests higher zph for objects that by visual inspection and SDSS classification clearly stellar: The available CFHT photometry alone does not allow for an accurate star/galaxy classification.
C.2. Matching with MMT
To investigate what benefit the four-band photo-zs yield, once the usual selection of galaxies by magnitude and half-light radius (Sect. 2.4) is applied, we now match the photo-z catalogue with the MMT KSB catalogue. We first notice that although 95.6% of galaxies in the MMT KSB catalogue are matched bijectively to a CFHT photo-z source, only 20.4% of the MMT lensing sources satisfy the quality criteria of four usable CFHT bands (NBPZ_GOODFILT = 4), o > 0.8, and no masking (CANDMASK = 0). We call these estimates high-quality photo-zs.
Counter-intuitive at the first glance, 76% of the high-quality matches have zph > 0.5, i.e. are likely background galaxies to CL 1701+6414. However, this effect can be traced back to the near-absence of high-quality estimates of zph < 0.3. This is consistent with our expectation from the comparison to the spectroscopic redshifts (Fig. C.1), where the lack of a u′ filter systematically offsets zph for zspec < 0.45 galaxies to higher values. The zph distribution derived from the four-band CFHT data deviates far from the redshift distributions known from well-studied photo-z fields (Ilbert et al. 2006, 2009, also see Fig. B.6 in Paper I). This holds in particular for the high-quality sub-catalogue which, containing brighter galaxies on average, traces a different population than our MMT lensing catalogue.
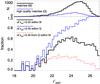 |
Fig. C.2
Upper panel: histograms of the MMT-photo-z matched catalogue as a function of MMT r′ magnitude: Plotted are all matches (thick black line) and the subset of matches with photo-zs passing all quality criteria (“high quality”, blue line). Lower panel: fractions of galaxies zph > 0.45 within: all MMT-photo-z matches (thick black line), the “high quality” matches (blue line), and of high-quality matches zph > 0.45 within all (dashed red line). A thin dotted line gives the magnitude cut at mfaint = 21.9. |
| Open with DEXTER | |
The upper panel of Fig. C.2, showing the magnitude distributions of the high-quality photo-z catalogue (solid blue line) compared to all matches (thick black line) demonstrates that high-quality photo-zs tend to belong to brighter galaxies. This can be seen from the modes of the histograms and is not surprising given the necessary detection in the shallow g′i′z′ images. While 98.5% of the sources in the MMT galaxy catalogue get matched to a photo-z galaxy, only for 26.7% the photo-z passes all quality cuts.
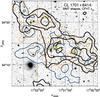 |
Fig. C.3
S-statisics in the CL 1701+6414 field using the CFHT photo-z catalogue. Thick black contours mark the shear signal from the zph < 0.45 catalogue, medium-thick blue contours are derived from the complementary zph ≥ 0.45 sources. Thin orange contours show the signal from the complete MMT galaxy catalogue. All contours start at S = 1 and are spaced by ΔS = 1. The underlying image and other contours are the same as in Fig. 3. |
| Open with DEXTER | |
In particular, the decline with magnitude of the fraction of high-quality matches
affects the fraction of background galaxies with respect to CL 1701+6414 at
z = 0.45 using our photo-zs: considering
high-quality matches only (solid blue curve in the lower panel of Fig. C.2), the fraction of “photometric background”
(zph > 0.45) increases strongly
with MMT r′ magnitude. In fact, all of the few
 high-quality matches show
zph > 0.45. With respect to the
complete catalogue (thick black line), however, the fraction of photometric background
galaxies peaks at
high-quality matches show
zph > 0.45. With respect to the
complete catalogue (thick black line), however, the fraction of photometric background
galaxies peaks at  and ~0.6 and decreases
towards fainter
and ~0.6 and decreases
towards fainter  . The
fraction of high-quality
zph > 0.45 galaxies compared to
all matches (red dashed line in Fig. C.2) runs
rather flat with , never
exceeding 0.3 and subsuming only 15.9% of all matches.
. The
fraction of high-quality
zph > 0.45 galaxies compared to
all matches (red dashed line in Fig. C.2) runs
rather flat with , never
exceeding 0.3 and subsuming only 15.9% of all matches.
We conclude that the quality of the CFHT data entering the photo-z estimation makes possible a rough estimation of a normal galaxy’s redshift, i.e. to decide if it is more likely to be in the foreground or in the background, but not a precise redshift distribiution from which ⟨β⟩ could be inferred more precisely than using a proxy photo-z catalogue of high quality (Sect. 2.5).
C.3. A photo-z shear catalogue
The photo-zs drawn from the CFHT g′r′i′z′ bands provide us with a rough redshift estimate. In order to test whether this information can be used to disentangle the shear signals of CL 1701+6414 and the foreground structure, in particular A 2246, we divide the MMT galaxy catalogue: galaxies with zph < 0.45 are sorted into the “photo-z foreground” catalogue, galaxies with zph ≥ 0.45 are sorted into the “photo-z background” catalogue. Because of the poor quality of most photo-z estimates we expect only a crude selection.
Figure C.3 shows the S-maps resulting from these two catalogues, overlaid on the MMT r′-image in the same fashion as for Fig. 3. Thick black contours denote iso-S-contours from the photo-z background catalogue, including 49.9% of the lensing catalogue (10.3 galaxies/arcmin-2). Solid blue contours in Fig. C.3 are drawn from the complementary photometric foreground catalogue; the signal from the complete galaxy catalogue is shown as thin orange contours.
The morphology of the S-peaks in the photo-z background map follows in its main features the complete catalogue, as we expect from a sample of true z > 0.45 galaxies. With Smax = 3.14, the peak to be associated with CL 1701+6414 is nearly as strong as for the full catalogue, and closer to the cluster’s ROSAT position. The A 2246 peak shows a similar high fraction of the complete catalogue signal, but the two clusters appear to be better separated. The photo-z-foreground S-morphology bears little resemblance to Fig. 3: although we still measure S ≈ 2 close to the position of CL 1701+6414, it can not be seen as a distinct peak. A 2246 is detected just below 3σ, with S > 3 only measured for the “SW peak”. This is consistent with our expectations: As A 2246 is at lower redshift, some signal should persist in a true foreground catalogue.
Re-defining the photo-z catalogue such that it only contains high-quality photo-zs > 0.45 (cf. Sect. C.2) results in a good resolution between the S-signals of the two main clusters but such catalogue suffers from the sparsity of sources (4.8 galaxies/arcmin-2).
Despite the outcome of this experiment matching our expectations, we keep in mind the typical uncertainty of σ(zph) ≈ 0.25 even for the high-quality photo-zs (Fig. C.1), similar to the redshift separation of CL 1701+6414 and A 2246. Hence, the photo-z selection using the available data is not inherently better than the Sect. 4.1 magnitude cut. Nonetheless, the CFHT photo-zs and lensing measurements confirm the detection of CL 1701+6414 as a shear source distinct from A 2246 and give credibility to its mass estimate, the aim of our investigations.
Appendix D: Notes on individual clusters
D.1. CL 0159+0030
Being located in the SDSS equatorial strip, CL 0159+0030 has been detected by Goto et al. (2002) in the SDSS commissioning data, using their photometric “cut and enhance” cluster finder. Plionis et al. (2005) followed up Goto et al. (2002) cluster candidates using archival XMM-Newton observations. From the 3800 s PN observation Plionis et al. (2005) analysed, only a 3σ upper flux limit of 2.1 × 10⁻¹⁴ erg cm-2 s-1 in the 0.5–2.0 keV energy range could be inferred. This non-detection disagrees both with the flux of 3.3 ± 0.4 × 10¹³ erg cm-2 s-1Vikhlinin et al. (2009a) measure for CL 0159+0030 with ROSAT and with their Chandra flux of 3.6 × 10¹³ erg cm-2 s-1 in the same band.
D.2. CL 0230+1836
For CL 0230+1836, there are neither detections of the cluster itself, independent from the 400d survey, nor other galaxy clusters within a 20′ radius listed in NED. To our knowledge, we are the first to study this high-z cluster with deep optical observations.
D.3. CL 0809+2811
We hypothesise that CL 0809+2811 is identical to ZwCl 0806.5+2822 at
αJ2000 = 08h09m34s,
 , a position
 off the CL 0809+2811 ROSAT
centre and at similar distance to the bright star in the field, where we do not see a
concentration of galaxies. Neither do we observe an overdensity of galaxies at the
position of a secondary shear peak with S = 2.9 (Fig. D.3). It is located at
αJ2000 = 08h09m08s,
δJ2000 = +28°05′22″. No cluster within 3′ of this
position is known to NED.
off the CL 0809+2811 ROSAT
centre and at similar distance to the bright star in the field, where we do not see a
concentration of galaxies. Neither do we observe an overdensity of galaxies at the
position of a secondary shear peak with S = 2.9 (Fig. D.3). It is located at
αJ2000 = 08h09m08s,
δJ2000 = +28°05′22″. No cluster within 3′ of this
position is known to NED.
D.4. CL 1357+6232
Lopes et al. (2004) conducted a cluster survey on digitised Second Palomar Observatory Sky Survey plates, using a Voronoi tesselation technique. In their catalogue, they quote a cluster of galaxies at αJ2000 = 13h57m22s, δJ2000 = +62°33′11″, where there is no source in the MegaCam image. Using the relation found between r′ magnitude, g′ − r′ colour and zspec for a subsample of clusters with spectroscopic redshifts, Lopes et al. (2004) assign z = 0.19 to their detection. (NSCS J135722+623311, their #7243). Noting that the position of NSCS J135722+623311 is only 16″ from the ROSAT centre of CL 1357+6232, we speculate that it might be the result of a confusion of CL 1357+6232 with two bright galaxies to its east, one of which (SDSS J135723.83+623246.1) has a measured redshift of z = 0.078.
D.5. CL 1416+4446
In addition to CL 1416+4446, we detect two other shear peaks at > 3σ significance to the west and south-west of CL 1416+4446. Lopes et al. (2004) list a cluster NSCS J141623+444558 in their catalogue which, by NED, is identified with CL 1416+4446. Furthermore, Lopes et al. (2004) detected a cluster of galaxies at αJ2000 = 14h16m09s and δJ2000 = +44°38′51″, with a redshift of z = 0.39. Less than 2′ north-east of these coordinates we find the south-western shear peak which coincides with the g′ = 20.1 galaxy SDSS J141613.33+443951.3. For this source, SDSS (Adelman-McCarthy et al. 2008) quotes a spectroscopic redshift of z = 0.397. Note that the brighter galaxy SDSS J141603.01+443725.1, located 2′ further to the south-west from the Lopes et al. (2004) cluster position has an SDSS zspec = 0.310 and does not correspond to an S-peak.
Barkhouse et al. (2006) detected a galaxy
cluster at  ,
,
 , coincident with the
western shear peak, comparing archival Chandra data to optical
g′r′i′
observations in the Chandra Multiwavelength Project. They assign a
redshift z = 0.427 to the cluster, designated BGV 50. In the same
Chandra observation, Barkhouse
et al. (2006) identified another cluster, BGV 53 at
, coincident with the
western shear peak, comparing archival Chandra data to optical
g′r′i′
observations in the Chandra Multiwavelength Project. They assign a
redshift z = 0.427 to the cluster, designated BGV 50. In the same
Chandra observation, Barkhouse
et al. (2006) identified another cluster, BGV 53 at
 and
and
 and a redshift of
z = 0.452, which does not correspond to a bright galaxy in the
MegaCam image or a peak in the S-statistics.
and a redshift of
z = 0.452, which does not correspond to a bright galaxy in the
MegaCam image or a peak in the S-statistics.
Out of the three confirmed clusters in the field, CL 1416+4446 not only is the only 400d X-ray cluster and the strongest lensing detection, but also appears to be the optically richest system in the MegaCam r′-band image. Therefore, CL 1416+4446 possibly presents the most massive system in a physically interacting super-structure, indicated by the z ≈ 0.40 redshifts of all mentioned clusters. Judging by the X-ray morphology, Vikhlinin et al. (2009a) classify CL 1416+4446 as a relaxed system, though. We conclude that the CL 1416+4446 field qualifies as an interesting candidate for further investigation concerning the existence of a super-cluster.
D.6. Cross-identifications of CL 1701+6414
Vikhlinin et al. (1998), on whose 160d ROSAT catalogue the 400d sample builds (cf. Burenin et al. 2007) detect four clusters in the field: VMF 189 (A 2246), VMF 190 (CL 1701+6414), VMF 191, and VMF 192. In an independent ROSAT analysis, Donahue et al. (2002) detect these same four clusters plus RX J1702+6407, which we do not detect in WL. The redshift of z = 0.7 found for the Donahue et al. (2002) optical counterpart of CL 1701+6414 deviates from the redshift of z = 0.45 measured by Burenin et al. (2007) and all other references. CL 1701+6414 is further listed as RX J1701.3+6414 in the Bright Serendipitous High-Redshift Archival ROSAT Cluster sample (Bright SHARC, Romer et al. 2000).
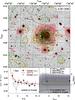 |
Fig. D.1
Like Fig. 2, but for CL 0159+0030. In the plot of r200 against cNFW, a square and dashed contours denote the model minimising Eq. (3) if no dilution correction is assumed. |
| Open with DEXTER | |
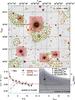 |
Fig. D.2
Like Fig. D.1, but for CL 0230+0030. Note that, in the lower right panel, the filled circle and downward triangle, denoting the best parameters for the free-cNFW abd B12-models are almost coincident. |
| Open with DEXTER | |
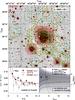 |
Fig. D.3
Like Fig. D.1, but for CL 0809+2811. |
| Open with DEXTER | |
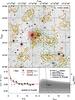 |
Fig. D.4
Like Fig. 2, but for CL 1416+4446. Small star symbols indicate the positions of further clusters in the field, which might be in physical connection to CL 1416+4446 as parts of a super-cluster. |
| Open with DEXTER | |
© ESO, 2012
Current usage metrics show cumulative count of Article Views (full-text article views including HTML views, PDF and ePub downloads, according to the available data) and Abstracts Views on Vision4Press platform.
Data correspond to usage on the plateform after 2015. The current usage metrics is available 48-96 hours after online publication and is updated daily on week days.
Initial download of the metrics may take a while.