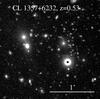
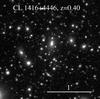
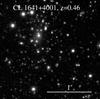
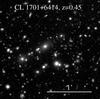
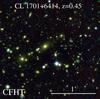
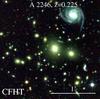
Fig. 1
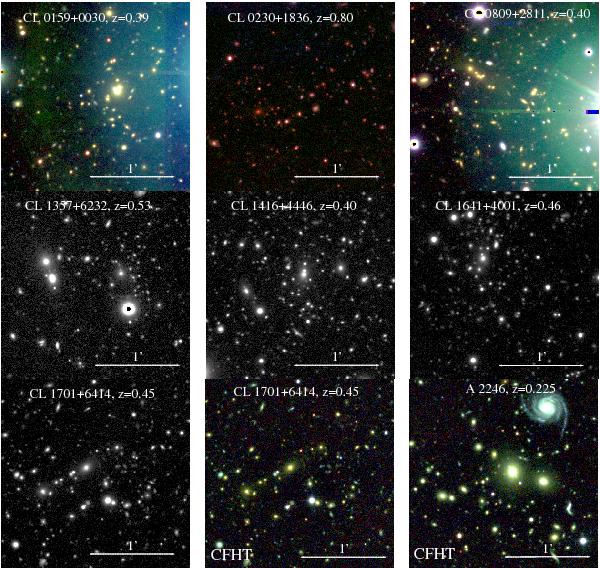
Clusters discussed in this paper. We show pseudo-colour images for the cases where colour is available, using the MMT g′r′i′ bands. For the CL 1701+6414 field, we also show pseudo-colour images using the CFHT g′r′i′ bands, both for CL 1701+6414 and A 2246. We choose the ROSAT cluster coordinates as centre of the images. Note the variable background due to bright stars near CL 0159+0030 and CL 0809+2811.
Current usage metrics show cumulative count of Article Views (full-text article views including HTML views, PDF and ePub downloads, according to the available data) and Abstracts Views on Vision4Press platform.
Data correspond to usage on the plateform after 2015. The current usage metrics is available 48-96 hours after online publication and is updated daily on week days.
Initial download of the metrics may take a while.