Fig. 9
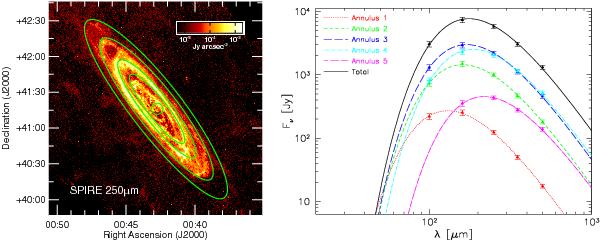
In the left-hand panel the 250 μm image is shown, together with the 5 apertures where fluxes were measured. The total aperture corresponds to the outermost elliptical aperture. The best fit values and uncertainties are given in Table 1. In the right-hand panel we show the fit to the observed SEDs as measured in the four apertures: observed fluxes (triangles) are superimposed to the modified black body curve (lines), corresponding to the best fit values of the temperature. Different colours and lines correspond to different apertures/annuli.
Current usage metrics show cumulative count of Article Views (full-text article views including HTML views, PDF and ePub downloads, according to the available data) and Abstracts Views on Vision4Press platform.
Data correspond to usage on the plateform after 2015. The current usage metrics is available 48-96 hours after online publication and is updated daily on week days.
Initial download of the metrics may take a while.