Fig. 7
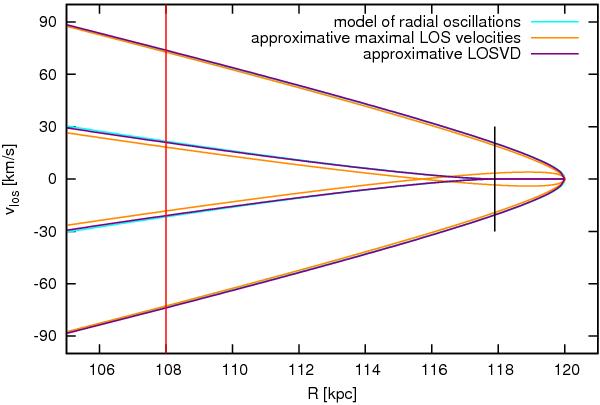
LOSVD peak locations for the second shell at the radius of 120 kpc (parameters of the shell are highlighted in bold in Table 1) according to the approximative maximal LOS velocities (Sect. 5, point 3) given by Eq. (17) (orange curves); the approximative LOSVD (Sect. 5, point 2) given by Eq. (15) (purple curves); and the model of radial oscillations (Sect. 2.3) (light blue curves almost merged with the purple ones). The red line shows the position of the LOSVD from Fig. 8, the black one shows the position of the current turning points. For parameters of the host galaxy potential, see Sect. 6.1.
Current usage metrics show cumulative count of Article Views (full-text article views including HTML views, PDF and ePub downloads, according to the available data) and Abstracts Views on Vision4Press platform.
Data correspond to usage on the plateform after 2015. The current usage metrics is available 48-96 hours after online publication and is updated daily on week days.
Initial download of the metrics may take a while.