Fig. 6
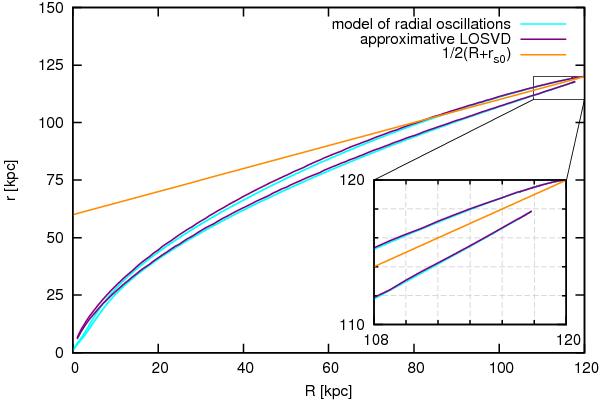
Galactocentric radii rvmax that contribute to the LOSVD the maximal velocities according to Eq. (16), which was used in the derivation of the approximative maximal/minimal LOS velocities (Sect. 5, point 3) – orange curve, according to the approximative LOSVD (Sect. 5, point 2) – purple curves, and according to the model of radial oscillations (Sect. 2.3) – light blue curves for the second shell at 120 kpc (parameters of the shell are highlighted in bold in Table 1). For parameters of the host galaxy potential, see Sect. 6.1.
Current usage metrics show cumulative count of Article Views (full-text article views including HTML views, PDF and ePub downloads, according to the available data) and Abstracts Views on Vision4Press platform.
Data correspond to usage on the plateform after 2015. The current usage metrics is available 48-96 hours after online publication and is updated daily on week days.
Initial download of the metrics may take a while.