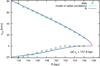
Fig. 13
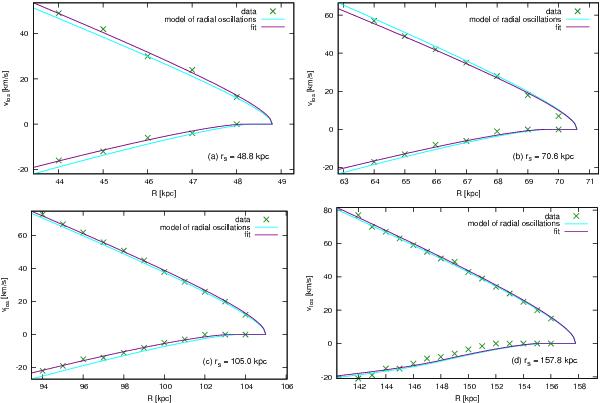
Fits for circular velocity vc and shell velocity vs using the approximative LOSVD (Sect. 5, point 2) given by Eq. (15) for four shells (rs indicated in bottom right corner of each plot) in the simulation 2.2 Gyr after the decay of the cannibalized galaxy. The best fit is the purple curve, and its parameters are shown in Tables 3 and 4 in the columns labeled vc,fit and vs,fit. The green crosses mark the measured maxima in the LOSVD, and the light blue curves show the locations of the theoretical maxima derived from the host galaxy potential according to the model of radial oscillations (Sect. 2.3). Note that the values of vc and vs used in the approximative LOSVD for the purple line were obtained by fitting the parameters to the simulated data, whereas in Figs. 7, 8, and 12, the values are known from the model of the host galaxy potential.
Current usage metrics show cumulative count of Article Views (full-text article views including HTML views, PDF and ePub downloads, according to the available data) and Abstracts Views on Vision4Press platform.
Data correspond to usage on the plateform after 2015. The current usage metrics is available 48-96 hours after online publication and is updated daily on week days.
Initial download of the metrics may take a while.