Fig. 12
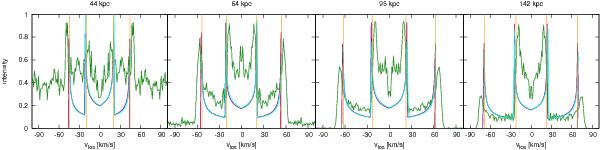
LOSVDs of four shells at projected radii 0.9rs (indicated as the title of each plot) 2.2 Gyr after the decay of the cannibalized galaxy (parameters of the shells are shown in Table 2). The simulated data are shown in green, the LOSVDs according to the approximative LOSVD (Sect. 5, point 2) given by Eq. (15) in purple, and LOSVDs according to the model of radial oscillations (Sect. 2.3) in light blue. The graph also shows the locations of the peaks using the approximative maximal LOS velocities (Sect. 5, point 3) given by Eq. (17) by orange lines. Profiles do not include stars of the host galaxy, which are not part of the shell system. The theoretical profiles are scaled so that the intensity of their highest peak approximately agrees with the highest peak of the simulated data. Intensity is given in relative units, so maxima of the profiles have values of about 0.9.
Current usage metrics show cumulative count of Article Views (full-text article views including HTML views, PDF and ePub downloads, according to the available data) and Abstracts Views on Vision4Press platform.
Data correspond to usage on the plateform after 2015. The current usage metrics is available 48-96 hours after online publication and is updated daily on week days.
Initial download of the metrics may take a while.