Fig. 11
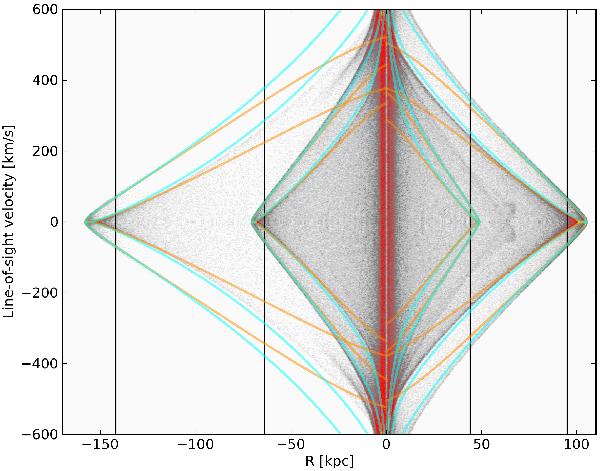
LOSVD map of the simulated shell structure 2.2 Gyr after the decay of the cannibalized galaxy (middle panel in Fig. 10). Light blue curves show locations of the maxima according to the model of radial oscillations (Sect. 2.3) for shell radius rs, corresponding serial number n, and the known potential of the host galaxy (Sect. 6.1). Orange curves are derived from the approximative maximal LOS velocities (Sect. 5, point 3) given by Eq. (17) for rs, vs,model, and vc,model. Parameters of the shells are shown in Table 2. Black lines mark the location at 0.9rs for each shell. The LOSVD for these locations are shown in Fig. 12. The map includes only stars originally belonging to the cannibalized galaxy.
Current usage metrics show cumulative count of Article Views (full-text article views including HTML views, PDF and ePub downloads, according to the available data) and Abstracts Views on Vision4Press platform.
Data correspond to usage on the plateform after 2015. The current usage metrics is available 48-96 hours after online publication and is updated daily on week days.
Initial download of the metrics may take a while.