Free Access
Fig. 1
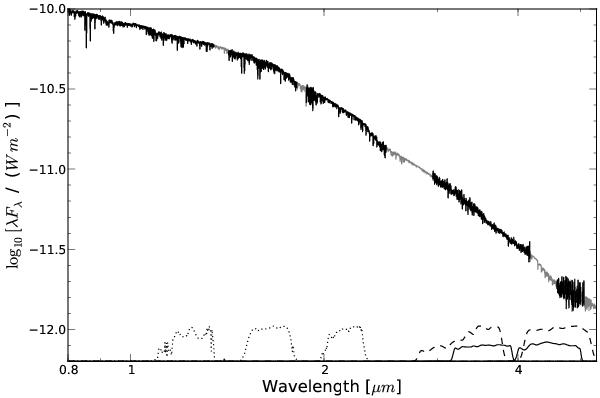
Absolutely calibrated, mostly empirical spectrum of 55 Cnc. The data in black are measured, while those in gray are modeled. At bottom are the response curves from 2MASS (dotted; Cohen et al. 2003), WISE (dashed; Jarrett et al. 2011), and Spitzer/IRAC (solid; Spitzer Science Center 2012).
Current usage metrics show cumulative count of Article Views (full-text article views including HTML views, PDF and ePub downloads, according to the available data) and Abstracts Views on Vision4Press platform.
Data correspond to usage on the plateform after 2015. The current usage metrics is available 48-96 hours after online publication and is updated daily on week days.
Initial download of the metrics may take a while.