Free Access
Fig. 9
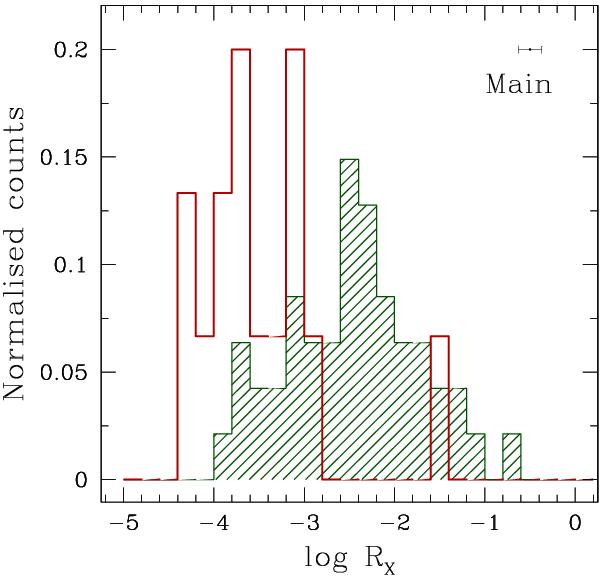
Normalised distribution of ℛX for the radio-detected sources in the “main sample”. RL, green shaded histogram; detected RI, red continuous line. The error bar reported represents the mean uncertainties in ℛX, obtained as detailed in Sect. 3.4.
Current usage metrics show cumulative count of Article Views (full-text article views including HTML views, PDF and ePub downloads, according to the available data) and Abstracts Views on Vision4Press platform.
Data correspond to usage on the plateform after 2015. The current usage metrics is available 48-96 hours after online publication and is updated daily on week days.
Initial download of the metrics may take a while.