Fig. 8
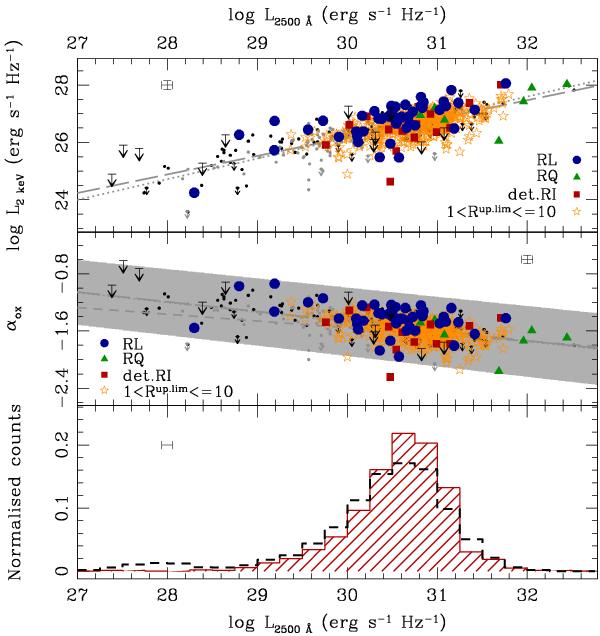
Dependence on the 2500 Å monochromatic luminosity of L2 keV (upper panel) and αox (central panel). Key as in Fig. 3: RL, blue filled circles; detected RI, red filled squares; undetected sources with ℛup.lim ∈ (1,10] , yellow open stars; RQ, green filled triangles. Big arrows correspond to the upper limits found for the 11 X-ray non-detected sources in the “control sample”. Only mean error bars are reported to avoid clutter. Our data are compared with results found in the literature for samples of sources of different luminosities from the SDSS. Long-dashed lines are the best-fit linear relations for the samples by Strateva et al. (2005), updating the work of Vignali et al. (2003, dashed lines); the dotted line represents the best fit to the Steffen et al. (2006) sample. The grey-shaded area gives the spread in the Steffen et al. (2006) best fit. Black and grey filled circles mark the SDSS objects with 0.1 ≲ z ≲ 4.5 from Strateva et al. (2005) and the data from Steffen et al. (2006, extending their work to a larger range in luminosities), respectively; arrows indicate upper limits in the X-ray detection. Lower panel: normalized distribution in L2500 Å (red shaded histogram); the black dashed line shows the distribution for the “control sample”.
Current usage metrics show cumulative count of Article Views (full-text article views including HTML views, PDF and ePub downloads, according to the available data) and Abstracts Views on Vision4Press platform.
Data correspond to usage on the plateform after 2015. The current usage metrics is available 48-96 hours after online publication and is updated daily on week days.
Initial download of the metrics may take a while.